 English
 usheenthermal

How to Conduct Failure Analysis of Insulating Thermal Materials
Failure analysis of insulating thermal materials isn’t lab trivia—it’s the difference between a product that hums for years and one that flames out on a Friday night shift. When insulation cracks under heat or voltage, production stalls, warranties spike, and someone’s phone starts buzzing. In high power electronics, heat is the silent pickpocket; it steals margins slowly, then all at once.
A 2025 IEEE reliability update notes thermal stress remains a top driver of power module failure. That’s not theory—that’s scrap rates and callbacks.
At Sheen Technology, our engineers say, “Insulation doesn’t fail loudly—it whispers before it snaps.” Catching those whispers—microvoids, delamination, dielectric fatigue—keeps your line moving and your buyers calm. This is how to spot trouble early, cut risk, and buy with confidence.
Key Points for Failure analysis of insulating thermal materials
➔ Characterize material specs: Review dielectric strength, thermal conductivity, moisture absorption, and flammability to match operating conditions.
➔ Accelerated aging: Simulate high-temperature and humidity exposure to detect early thermal degradation and property shifts.
➔ Dielectric testing: Measure breakdown voltage and insulation resistance to pinpoint electrical failure paths.
➔ Microscopy analysis: Inspect for delamination, voids, and microcracks that whisper of impending delamination.
➔ Prevent recurrence: Verify supplier consistency, optimize material compatibility, and establish performance certification standards.
5 Essential Steps for Insulating Material Failure Analysis
Failure happens fast, but root causes hide deep. In real projects, Failure analysis of insulating thermal materials is not just lab talk; it keeps equipment safe and budgets under control. From insulating layers to thermal barriers, understanding failure analysis of insulating thermal materials helps engineers fix problems before downtime hits hard.
Step 1: Characterize Material Specifications and Dielectric Strength
When running Failure analysis of insulating thermal materials, start with core material properties:
Electrical Performance
· dielectric constant
· insulation resistance
· breakdown voltage
Thermal Behavior
· thermal conductivity
· heat dissipation limits
Chemical Profile
· material composition
· moisture sensitivity
If specs don’t match operating stress, failure analysis of insulating thermal materials quickly points to mismatch rather than random damage.
Step 2: Conduct Accelerated Aging to Reveal Thermal Degradation
Thermal damage rarely shows up overnight.
Environmental Stress
· thermal aging
· long-term temperature exposure
· humidity testing
Radiation & Oxidation
· UV radiation
· oxidative degradation
Mechanical Impact
· repeated thermal stress

This stage of Failure analysis of insulating thermal materials exposes insulation material failure patterns early, especially in polymer-based systems.
Step 3: Perform Dielectric Testing for Electrical Breakdown Insights
Electrical faults leave clues.
Voltage Evaluation
· voltage testing
· AC breakdown voltage

Discharge Detection
· partial discharge
· rising dielectric loss
Failure Indicators
· electrical breakdown
· reduced dielectric strength
Accurate testing keeps thermal insulation failure analysis grounded in measurable data.
Step 4: Use Microscopy Analysis to Detect Delamination and Voids

Visual proof matters.
Surface checks
· optical microscopy
· surface defects
Internal review
· SEM analysis
· cross-section analysis
Structural flaws
· delamination
· internal voids
Microscopy connects physical defects to electrical or thermal stress in Failure analysis of insulating thermal materials.
Step 5: Validate Mechanical Stability under Vibration Stress
Mechanical integrity seals the story.
Dynamic checks
· vibration testing
· cyclic mechanical stress

Strength metrics
· tensile strength
· flexural strength
· impact resistance
Long-term outcome
· material fatigue
· overall structural integrity
In real-world applications, Sheen Technology integrates thermal insulation failure analysis with mechanical validation to prevent repeat breakdowns. For industries chasing reliability, Sheen Technology supports smarter Failure analysis of insulating thermal materials—less guesswork, more control.
Equipment You Need for Insulation Failure Analysis
Failure analysis of insulating thermal materials sounds technical, but at its core it’s about figuring out why heat insulation and electrical barriers break down. When failure, analysis, and insulating thermal materials meet in the lab, the right tools make all the difference. Solid insulation failure investigation starts with controlled measurement, not guesswork.
Thermal Imaging Camera for Hot-Spot Detection

In failure analysis of insulating thermal materials, heat tells stories fast.
Core hardware
· Infrared camera with high thermal resolution
· Adjustable emissivity setting for polymer, epoxy, or fiberglass
Measurement focus
· Real-time temperature measurement
· Tracking thermal gradient across interfaces
· Pinpointing spot temperature anomalies
Data workflow
· Continuous data logging
· Comparative maps before and after load cycling
When insulation thermal materials degrade, conductivity shifts. That shift shows up as uneven gradients. A quick scan often reveals hidden hot zones tied to voids or poor bonding, supporting early-stage failure analysis work.
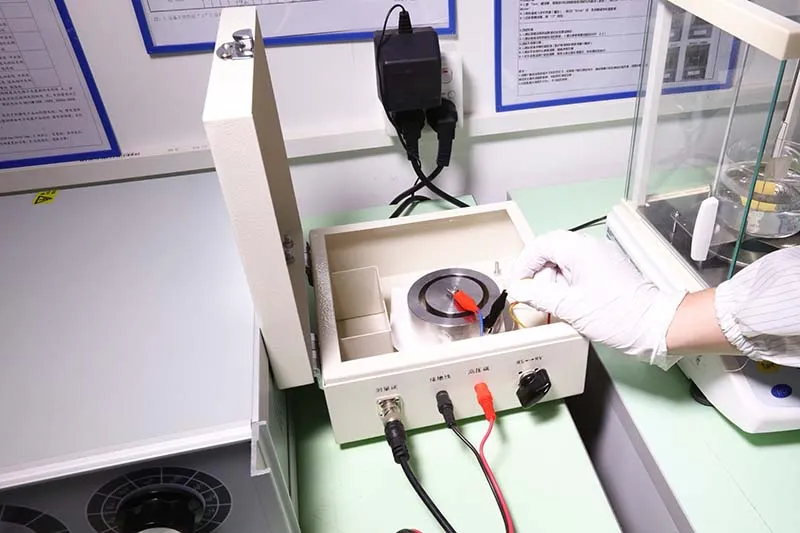
Dielectric Testing Rig to Measure Breakdown Voltage

Electrical stress testing is central to failure analysis of insulating thermal materials and overall insulation failure analysis.
Setup
· Stabilized high voltage source
· Defined electrode configuration
· Secure sample holder
Test control
· Programmed voltage ramp rate
· Continuous insulation resistance tracking
Detection
· Automated breakdown detection
· Calculation of dielectric strength
| Sample ID | Thickness (mm) | Ramp Rate (kV/s) | Breakdown Voltage (kV) | Dielectric Strength (kV/mm) |
| A1 | 1.0 | 0.5 | 18 | 18 |
| A2 | 1.2 | 0.5 | 20 | 16.7 |
| B1 | 0.8 | 1.0 | 14 | 17.5 |
| B2 | 1.5 | 0.5 | 24 | 16 |
| C1 | 1.0 | 1.0 | 16 | 16 |
Numbers like these ground electrical insulation defect analysis in facts, not assumptions.
Environmental Chamber for Humidity Exposure & Thermal Cycling
Material aging rarely happens in calm lab air.

Climate control system
· Precise temperature control
· Active humidity control with dew point control
Stress profiles
· Rapid thermal shock
· Programmed humidity cycling
· Controlled rate of temperature change
Exposure management
· Uniform specimen chamber airflow
Moisture absorption drives swelling. Swelling shifts stress. Over cycles, microcracks grow. This chain reaction is classic in failure analysis of insulating thermal materials and broader thermal insulation failure analysis.
Microscopy Setup for Void Formation and Delamination Inspection
After thermal and electrical stress, visual proof matters.
Under an optical microscope, analysts adjust magnification levels and tune the illumination source to highlight cracks. The sample stage stabilizes cross-sections, while image capture software records defects.
Cross-section analysis exposes interfacial gaps. Surface morphology shows blistering. Tiny void formation today can mean major insulation breakdown tomorrow.
In short, failure analysis of insulating thermal materials becomes clearer when heat maps, voltage data, climate stress, and micrographs all line up.
Interpreting Thermal Imaging Results Accurately
Thermal scans can look simple, but reading them right takes sharp eyes and solid method. In Failure analysis of insulating thermal materials, small misreads can snowball into costly fixes. This guide breaks down how to read patterns, check temperature gradients, and connect thermal anomalies to real material trouble without overthinking it.
How to Identify Hotspots vs Normal Thermal Expansion?
In Failure analysis of insulating thermal materials, separating true hotspots from routine thermal expansion is where skill shows up.
Baseline comparison
· Capture reference thermal imaging data at stable load.
· Log average surface temperature across identical zones.
· Track shifts in temperature gradients over time.
Load condition review
· Normal material behavior under rising load shows smooth, wide-area warming.
· Localized spikes with sharp boundaries often signal insulation gaps or failing joints affecting insulation integrity.
Conductivity cross-check
· Materials with steady conductivity show predictable spread.
· Sudden concentrated heat zones suggest abnormal resistance paths.
| Test Area | Baseline Temp (°C) | Load Temp (°C) | Gradient (°C/cm) | Assessment |
| Panel A | 32 | 45 | 0.8 | Normal expansion |
| Panel B | 31 | 67 | 3.5 | Local hotspot |
| Joint C | 30 | 52 | 1.2 | Monitor |
| Panel D | 33 | 34 | 0.2 | Stable |
| Edge E | 29 | 61 | 4.1 | Insulation fault |
Clear numbers reduce guesswork in Failure analysis of insulating thermal materials and keep inspections grounded in data.
Quantifying Thermal Conductivity Variations from IR Data
When running Failure analysis of insulating thermal materials, conductivity shifts are key.
Start simple:
· Measure calibrated emissivity.
· Map temperature distribution across equal spacing.
· Estimate relative heat flux from gradient intensity.
Then tighten it up:
1) Capture steady-state infrared data.
2) Calculate apparent thermal resistance using ΔT and input power.
3) Compare zones to known material properties benchmarks.
4) Flag deviations beyond 15% for deeper failure analysis of insulating systems.
Short notes matter. High gradient, low spread? Likely reduced thermal conductivity. Wide warm area with mild slope? Probably normal diffusion.
The International Energy Agency’s 2025 building efficiency outlook noted that improved thermal diagnostics can reduce energy loss by up to 20% when insulation faults are detected early.
That’s why teams working with Sheen Technology rely on calibrated infrared systems during Failure analysis of insulating thermal materials—solid data beats gut feeling every time.
Correlating Thermal Anomalies with Material Defects
In Failure analysis of insulating thermal materials, patterns tell stories.
A. Surface-level indicators
· Persistent thermal anomalies at seams.
· Uneven cooling after shutdown.
B. Subsurface concerns
· Voids trapping air pockets.
· Micro cracks spreading heat irregularly.
· Delamination separating bonded layers.
C. Degradation pathways
· Moisture entry → rising local conductivity → insulation degradation.
· Electrical overload → concentrated heating → evolving failure modes.
· Long-term cycling → structural fatigue → reduced structural integrity.
Cross-check infrared findings with microscopy or ultrasonic scans. If anomalies repeat under identical load, odds are high a material defect sits underneath.
Sheen Technology supports Failure analysis of insulating thermal materials by aligning infrared diagnostics with lab validation, making thermal insulation failure analysis clear, direct, and practical for real-world engineering teams.
Diagnosing Mechanical vs Thermal Insulation Failures
Failure analysis of insulating thermal materials sounds technical, yet in daily engineering work it simply means figuring out why insulation stopped doing its job. In practice, Failure analysis of insulating thermal materials connects lab data with what actually broke in the field.
Mechanical Stress
In Failure analysis of insulating thermal materials, mechanical loading often leaves visible clues before performance drops.
Crack and fracture mapping
1.1 Surface indicators
· Micro-cracks near stress concentration zones
· Edge splits caused by impact damage
1.2 Sub-surface indicators
· Internal delamination from cyclic fatigue
· Fiber pull-out reducing tensile strength
Deformation assessment
2.1 Compression-related faults
· Permanent set under long-term compression
· Reduced thickness from abrasion
2.2 Shear-related faults
· Layer sliding due to excessive shear stress
· Mounting misalignment amplifying local stress
Load-path evaluation
3.1 Vibration coupling
· Resonance increasing cyclic stress
3.2 Thermal expansion mismatch
· Differential strain building hidden cracks
Mechanical failure analysis of thermal insulation materials often shows that small assembly errors snowball into structural breakdown.
Thermal Degradation
Thermal insulation failure analysis shifts focus to heat history and chemistry.
Common warning signs include:
· Color darkening from oxidation
· Surface crazing after thermal shock
· Brittleness linked to embrittlement
Key thermal indicators in Failure analysis of insulating thermal materials:
| Material State | Temp (°C) | Dielectric Strength (kV/mm) | Mass Loss (%) | Dominant Mechanism |
| Initial | 25 | 18 | 0 | Stable structure |
| Aged 500 h | 120 | 15 | 1.2 | Early oxidation |
| Aged 1000 h | 180 | 11 | 3.8 | Creep + micro-crack growth |
| Overlimit | 240 | 6 | 8.5 | Decomposition temperature exceeded |
When high temperature exposure continues past design limits, polymer chains break down. A subtle phase change can precede full material collapse.
Solid Failure analysis of insulating thermal materials ties these lab numbers to real overheating events, poor cooling paths, or chemical attack—no mystery, just physics catching up.
Preventing Recurring Insulation Failures
Recurring breakdowns rarely happen out of nowhere. Most trace back to weak material properties, overlooked environmental factors, or gaps in Failure analysis of insulating thermal materials. Getting serious about Failure analysis of insulating thermal materials means tightening design, sourcing, and validation all at once.
Optimize Material Compatibility for Long-Term Reliability
Failure analysis of insulating thermal materials often reveals hidden chemical interactions and uneven thermal degradation.
Material pairing review
· Ceramic core:Check aging mechanisms under cyclic heat.
· Resin system:Validate resistance to moisture-driven decay.
· Elastomer seals:Compare expansion rates to avoid stress cracks.
Thermal mismatch data used in insulation failure analysis:
| Material Pair | ΔCTE (ppm/°C) | Service Temp (°C) | Expected Service Life (yrs) |
| Ceramic/Epoxy | 18 | 180 | 8 |
| Ceramic/Silicone | 9 | 220 | 12 |
| Alumina/Resin Blend | 6 | 200 | 15 |
| Glass/Elastomer | 22 | 150 | 6 |
Tighter ΔCTE means longer service life. Simple, but often ignored.
Implement Supplier Qualification and Batch Consistency Checks
Solid Failure analysis of insulating thermal materials depends on clean sourcing.
Supplier audits
· Review production controls
· Confirm alignment with material specifications
Batch testing
· Dielectric strength sampling
· Mechanical pull tests
· Archive results for traceability
Incoming inspection
· Visual screening
· Randomized lab validation
· Flag variance beyond quality control limits
Sheen Technology supports insulation material failure analysis by linking lab data with supplier history, so surprises drop fast.
Enhance Design Considerations for Environmental Resistance
Insulation design failure usually screams one thing: stress.
Thermal side
· Map thermal stress under peak load
Moisture side
· Seal against moisture ingress
· Test after 85% RH exposure
External aging
· Screen for UV exposure
· Check resistance to chemical attack
Structure
· Reinforce for vibration to protect mechanical integrity
Quick fixes don’t cut it. Failure analysis of insulating thermal materials shows that spacing, airflow, and coating thickness all matter.
Establish Performance Validation and Certification Standards
No validation, no confidence. That’s the rule.
Define testing protocols
· High-pot
· Thermal cycling
· Salt spray
Track performance metrics
· Dielectric loss
· Insulation resistance
Align with industry standards and approved certification bodies
Document full reliability assessment before release
Failure analysis of insulating thermal materials closes the loop here. When insulation thermal material failure analysis feeds back into qualification testing, recurring faults slow down. That’s how Sheen Technology keeps products steady in the real world.
FAQs about Failure Analysis Of Insulating Thermal Materials
How does failure analysis of insulating thermal materials influence large-scale procurement decisions?
Failure analysis turns purchasing into risk control rather than guesswork.
Short view: it exposes hidden weakness before contracts are signed.
· Checks thermal conductivity drift under high temperature and electrical stress.
· Confirms dielectric strength stability through dielectric testing.
· Reveals void formation and delamination via microscopy analysis.
· Verifies supplier qualification and batch consistency against material specification.
When ceramic insulators, epoxy resins, or silicone elastomers face accelerated aging and humidity exposure, small defects become visible. Procurement teams gain proof of long-term reliability instead of relying on datasheets alone.
What testing methods are critical for identifying insulation failure mechanisms?
Failure rarely comes from one cause; it grows through layered stress.
Accelerated aging + thermal cycling
· Simulates high temperature and mechanical vibration
· Tracks thermal degradation and thermal expansion mismatch
Dielectric testing
· Measures breakdown voltage under electrical stress
· Detects early electrical breakdown in polymer composites or mica-based materials
Humidity exposure & chemical exposure tests
· Evaluates moisture absorption
· Identifies chemical attack in fiberglass laminates
Mechanical testing + microscopy analysis
· Confirms mechanical stability
· Locates microcracks, delamination, and internal defects
· Each method captures a different fracture line before it widens into failure.
Why is dielectric strength so critical in demanding application environments?
In high humidity, radiation exposure, or sustained electrical stress, insulation lives on the edge.
Dielectric strength defines the boundary between safe operation and sudden electrical breakdown. When thermal degradation lowers insulation resistance, even stable materials like ceramic insulators or epoxy resins can falter.
Key linked properties:
· Thermal conductivity → controls heat buildup
· Moisture absorption → weakens electrical insulation
· Flammability rating → limits secondary damage
· Mechanical stability → resists crack growth under vibration
If dielectric strength collapses, the system does not slowly decline; it fails abruptly. That tension drives strict performance validation and certification standards.
How can recurring insulation failures be prevented in mass production?
Prevention blends design discipline with quality control.
Design considerations
· Align thermal management with real high temperature loads
· Ensure material compatibility between silicone elastomers, mica-based materials, and fiberglass laminates
· Account for mechanical integration under vibration
Quality control actions
| Control Focus | Practical Measure | Target Risk |
| Supplier qualification | Audit process stability | Batch variation |
| Defect detection | Microscopy + dielectric testing | Void formation |
| Performance validation | Accelerated aging & humidity exposure | Long-term reliability |
| Certification standards | Documented material specification | Compliance gaps |
When material properties, failure mechanisms, and application environments are evaluated together, recurring failures lose their hiding place.


