
 English
 usheenthermal

The 0.2 mm Graphene Thermal Pad: What SHEEN's GSF110-020 Test Data Actually Tells Us
Date:2026-10-19
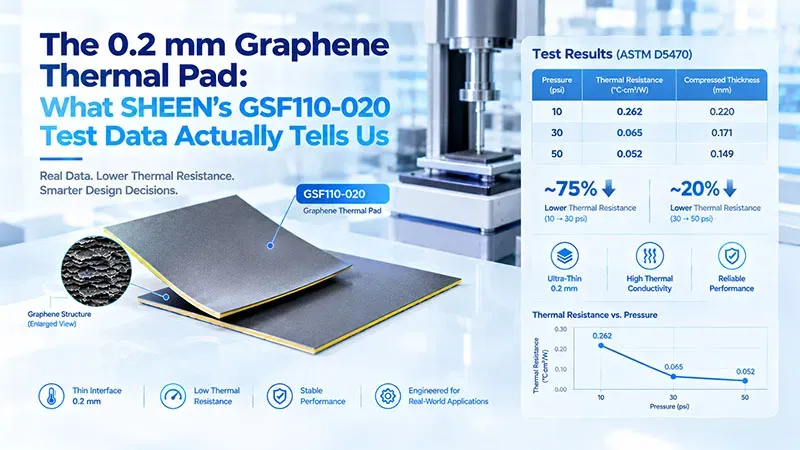
Let's be honest about how thermal interface materials actually get picked. Nobody falls in love with a spec sheet. Engineers choose pads the way you'd pick a mattress — it's all about the gap, the squeeze, and how much temperature you're willing to lose in the process. That's exactly why the new GSF110-020 graphene thermal pad from Sheen Advanced Materials is worth a look: it's genuinely thin, genuinely low-resistance, and it comes with the kind of pressure–thickness–resistance data that lets you spec it like a grown-up.
SHEEN's quality laboratory tested the material at three pressures using an LW-9389 testing system, following ASTM D5470 as specified in the test report. The results show how thermal resistance and compressed thickness change as the pressure increases.
Here's the quick version:
- At 10 psi: Thermal resistance was 0.262 °C·cm²/W.
- At 30 psi: Thermal resistance dropped to 0.065 °C·cm²/W.
- At 50 psi: Thermal resistance reached 0.052 °C·cm²/W.
Read those middle two rows together and you get the headline: thermal resistance drops ~75% going from 10 to 30 psi, and squeezing from 30 to 50 psi shaves off another ~20%. In plain English? This pad barely gets out of bed below 10 psi, but by 30 psi it's doing real work, and by 50 psi it's basically the thermal equivalent of a firm handshake.
For design purposes, that's a gift. If your stack can only muster ~10 psi, don't fantasize about the 0.052 number — budget for 0.262 at that pressure point. If your clamping scheme allows 30–50 psi, you've got a thin interface that compresses to 0.171 mm / 0.149 mm and punches well above its weight class.
GSF110-020 Test Results: Three Pressures, Three Different Outcomes
Here's the full set of reported measurements.
| GSF110-020 0.2 mm Graphene Thermal Pad Thermal Resistance Test | ||||
|---|---|---|---|---|
| Applied Pressure | Approx. Pressure (kPa) | Thermal Resistance (°C·cm²/W) | Compressed Thickness (mm) | Compression Ratio |
| 10 psi | 69 | 0.262 | 0.197 | 1.5% |
| 30 psi | 207 | 0.065 | 0.171 | 14.5% |
| 50 psi | 345 | 0.052 | 0.149 | 25.5% |
Source: SHEEN internal quality laboratory test report for GSF110-020. The reported average sample temperature was approximately 80°C at all three pressure points.
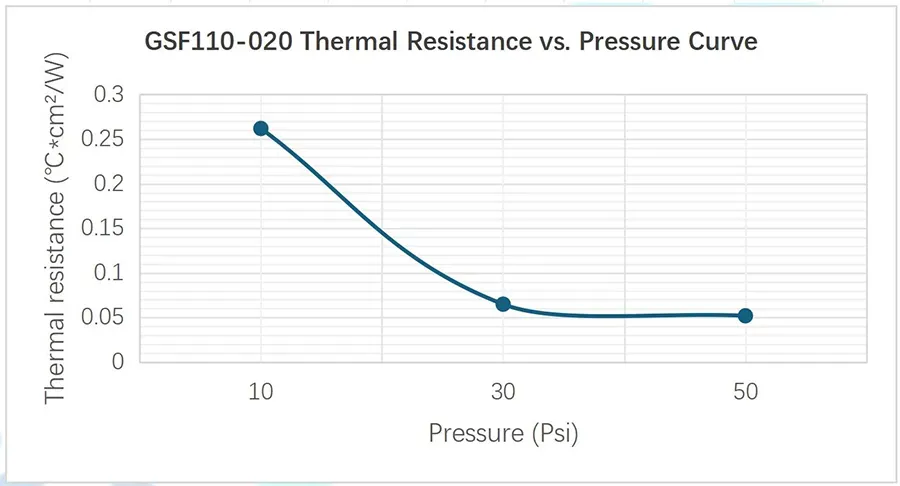
Look at the change between 10 and 30 psi. Thermal resistance fell from 0.262 to 0.065 °C·cm²/W—a reduction of approximately 75.2%.
Increasing pressure from 30 to 50 psi brought another reduction, from 0.065 to 0.052 °C·cm²/W, or about 20%.
That's a substantial difference across the tested pressure range. But notice something else: the material also gets thinner under load.
At 10 psi, the measured thickness was 0.197 mm. At 30 psi, it dropped to 0.171 mm. At 50 psi, it reached 0.149 mm.
In other words, pressure changes both the thermal resistance and the space the pad occupies.
Here's the practical takeaway: Don't choose GSF110-020 based on its lowest reported thermal resistance alone. Start with the pressure your assembly can safely and consistently apply, then use the corresponding test result as your reference.
If your design operates around 10 psi, the relevant reported value is 0.262 °C·cm²/W—not 0.052. That distinction matters when you're working with a tight thermal budget.
Why 0.052 °C·cm²/W Matters: It's Temperature You Get to Keep
A quick unit refresher: °C·cm²/W is area-normalized thermal resistance, which makes the math insultingly easy in 1D, uniform-heat conditions:
Interface ΔT ≈ heat flux × area-normalized thermal resistance
If your application can actually replicate the 50 psi test condition:
| Assumed heat flux | Estimated interface ΔT |
| 50 W/cm² | 2.6 °C |
| 100 W/cm² | 5.2 °C |
| 200 W/cm² | 10.4 °C |
Every degree you don't burn across an interface is a degree your die doesn't have to sweat through. In a world where AI silicon is casually throwing 100+ W/cm² at a cold plate, keeping interface ΔT in single digits is basically found money for your thermal budget.
Standard caveat, obviously: these are back-of-envelope numbers from one tested resistance value. Real hardware has hot spots, spreading resistance, contact reality, and a whole cooling system behind it. Component- and system-level testing is where theory goes to get its paycheck.
Where Is a Thin Graphene Thermal Pad Worth Evaluating?
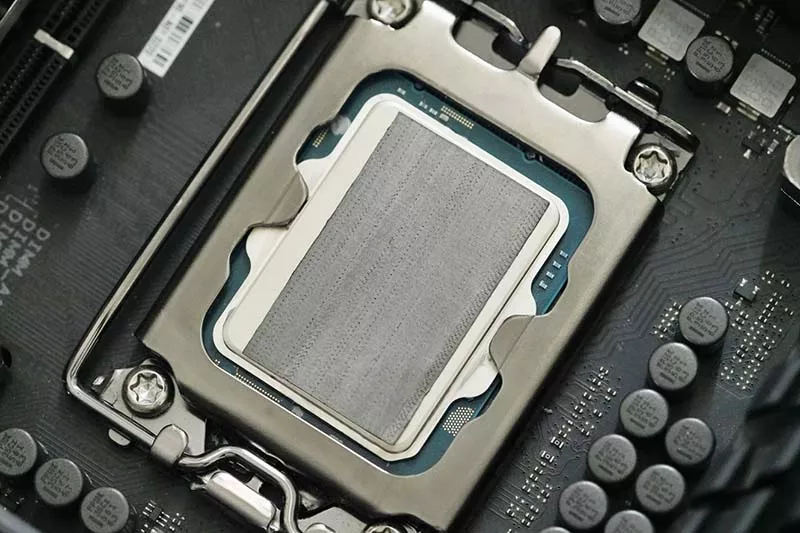
A 0.2 mm thermal interface can be attractive when space is limited and the mounting conditions are well controlled. Several applications are worth considering, although the GSF110-020 test report itself does not establish qualification for any specific end product.
| Potential Application | What to Check First |
|---|---|
| AI server GPU or CPU to heat sink or cold plate | Can the assembly provide consistent contact without exceeding allowable clamping loads? |
| AI accelerator cards and OAM modules | Does the compressed thickness fit the mechanical tolerance stack-up? |
| Data center switch ASICs | Is pressure distributed evenly across the contact area, including around localized hotspots? |
| High-speed optical modules | Can the interface meet thermal requirements within the available space and pressure limits? |
AI server GPUs and CPUs
High-performance processors leave little room for mistakes in thermal design. Where the interface gap is small, a thin thermal pad may be worth evaluating.
The first question is whether the pad can establish effective contact between the package lid and the cooling structure at the pressure available in the assembly.
Don't assume a thinner pad will always perform better. Check the measured interface resistance and the mechanical fit under realistic mounting conditions.
AI accelerator cards and OAM modules
Compact accelerator assemblies can have tight dimensional tolerances. The difference between nominal thickness and compressed thickness may affect mounting and contact.
The GSF110-020 measurements provide reference points for evaluating how the pad behaves at 10, 30, and 50 psi.
Data center switch ASICs
High-power switch ASICs can create localized heat concentrations. In these designs, average thermal resistance is only part of the picture.
Check contact quality across the full interface, pressure distribution, and local temperature behavior before deciding whether the material is suitable.
High-speed optical modules
Space constraints can make thin thermal interfaces appealing in optical hardware. However, thermal performance isn't the only consideration.
Depending on the design, engineers may also need to assess electrical isolation, material cleanliness, assembly compatibility, and particle generation if the interface experiences repeated contact or removal.
These are potential evaluation directions, not claims of confirmed GSF110-020 deployment. Actual suitability has to be demonstrated on the intended assembly.
The Right Way to Use This Report
Here's the workflow, in three moves:
- Pick your pressure. What can your stack actually apply, safely and uniformly? That pressure point is your number — not the prettiest one on the table.
- Pick your thickness. Confirm the compressed working thickness fits your gap, warpage, roughness, and tolerance budget.
- Prove it in the build. Validate on the real component — and if this is headed to production, qualify multi-batch consistency plus performance retention after thermal cycling, high-temperature storage, and long-term compression. Lab data becomes a purchasing spec only after it survives reality.
If your project needs a thin, low-resistance thermal interface, Sheen Advanced Materials would love to hear about it. Bring these five things to the conversation and you'll get a much more useful answer:
- The device, its power, and the effective contact area
- The actual interface gap and dimensional tolerances
- Available clamping force / contact pressure
- Operating temperature and reliability requirements
- Electrical isolation needs and your current material
【Request a Custom Quote】Share these details with SHEEN to discuss whether GSF110-020 is a suitable candidate and which additional tests would help establish its performance in your design.
Test data source: SHEEN internal quality laboratory test report for GSF110-020, dated September 24, 2026. Testing was conducted using an LW-9389 system, with ASTM D5470 identified as the test method. The average sample temperature was approximately 80°C at all three pressure points. The lowest reported thermal resistance, 0.052 °C·cm²/W, corresponds to 50 psi and a compressed thickness of 0.149 mm. Results are provided for material-selection reference; actual performance depends on assembly and operating conditions.
Sheen Thermal
Dongguan Sheen Electronic Technology Co., Ltd · Founded in 2008
Manufacturer of thermal interface materials and silicone foam for automotive electronics, energy storage, power electronics, communications and consumer electronics.
Certified
- ISO 9001:2015
- ISO 14001:2015
- IATF 16949:2016
What we supply
- Thermal conductivity Up to 90 W/m·K
- Thickness 0.3–10.0 mm
- Custom & samples Die-cut to drawing, 3–7 days
LAST:Nothing