
 English
 usheenthermal

Replacing Thermal Grease in Heatsink Module Testing: What BN and Graphene Pads Must Prove First
Date:2026-11-09
So you swapped the grease for a thermal pad, and the first article passed temperature. Can the line switch over now?
For heatsink module testing, there is a sharper question hiding underneath: after the interface material changes, can the equipment still reliably catch the units that used to sit near the reject boundary? A marginal defect that slips through costs far more than a degree of temperature.
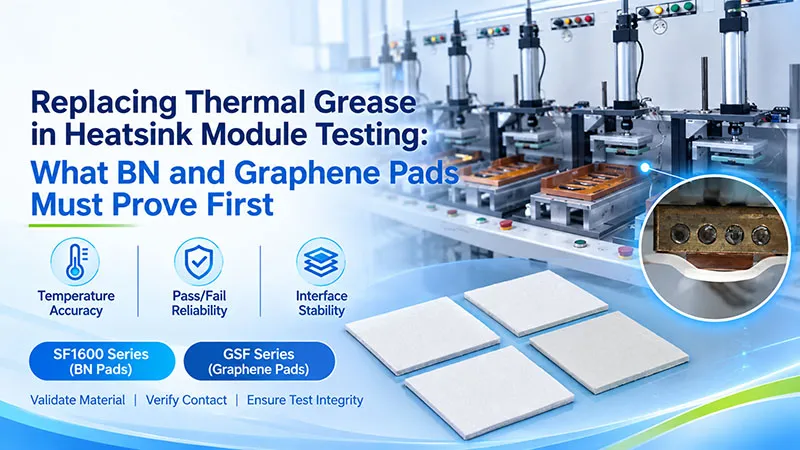
Once the interface between the heat source and the device under test changes, temperature offset, heating rate, and contact repeatability can all move with it. That's why a valid replacement validates three things together — material selection, fixture contact, and pass/fail judgment — not just the temperature reading.
Drawing on Sheen's application records from 280 W and 600 W air-cooled heatsink module testing, this article walks through how the SF1600 series boron nitride pads and the GSF series graphene pads enter a test process — and what they have to prove before production switches over.
Where the Pad Sits — and the Two Jobs It Has to Hold
The scenario here is thermal performance testing of the heatsink module itself. The test equipment feeds heat through a heat-source fixture into the vapor chamber (VC) or module under test, and the interface material sits between the two. The pad stays on the fixture; each module is loaded, tested, and separated in turn.
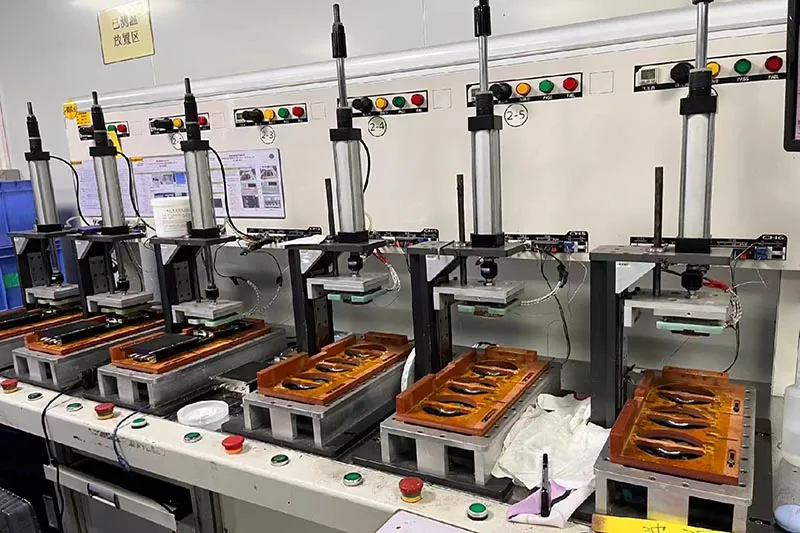
Figure 1. Heatsink module testing on the line. The pad works at the interface between the heat-source fixture and the module under test.
This thin layer carries two obligations at once: form a stable thermal contact under the allowed mechanical load, and keep enough repeatability across continuous testing. Thickness, contact area, positioning, and the separation motion all become process-control items.
And here's the failure mode to respect: if the pad adds a large, fluctuating extra resistance, the measured differences start mixing interface behavior into product behavior. The equipment ends up comparing pads instead of comparing modules.
Through-Plane Heat Flow: Why Vertical Orientation Matters
Heat travels from the fixture through the material's thickness to reach the module. So the property that matters most is through-plane (thickness-direction) heat transfer, judged together with the total interface resistance after assembly.
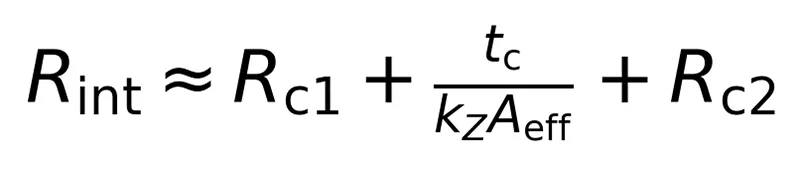
Figure 2. First-order interface resistance model: contact terms plus the material's bulk term.
The expression above approximates one-dimensional steady-state analysis; spreading resistance and bypass heat paths are not expanded. Here t is the compressed thickness, kᴢ is the through-plane thermal conductivity, and A is the effective heat-transfer area; in SI units the resistance comes out in K/W.
Raising conductivity pulls down the bulk term — but poor conformance, uneven pressure, or a poorly chosen thickness can still leave the two contact terms as the bottleneck. Fair comparisons live at the same temperature, pressure, and contact condition, not on a datasheet.
Two Candidates, One Comparison: SF1600-BN vs GSF90-03
For this scenario, SF1600 refers to Sheen's SF1600-BN boron nitride thermal pad; on the graphene side, GSF90-03 is the starting grade because it already has inspection-case history. Here is how the two enter a candidate list:
| Selection Dimension | SF1600-BN Boron Nitride Pad | GSF90-03 Graphene Pad |
|---|---|---|
| Primary need to evaluate | Heat transfer combined with electrical insulation | Tighter interface-resistance budget; a lower-resistance option to assess |
| Thickness used in the cases | 0.2 mm | 0.3 mm |
| Thermal conductivity | 16 W/(m·K) | 90 W/(m·K) |
| Thermal resistance | ≤0.3 °C·cm²/W (0.2 mm, 40 psi) | ≤0.1 °C·cm²/W (0.3 mm, 40 psi) |
| Key confirmations at introduction | Conformance at actual pressure, insulation needs, thickness match | Resistance at actual pressure, surface integrity, electrical-isolation needs |
40 psi is approximately 276 kPa — a material test condition, not a recommended clamping pressure for VC test fixtures. 0.2 mm is the specification used in the case records; production supply and parameters follow the confirmed specification documents. The two columns use different thicknesses, so this is not a same-thickness material comparison.
Choosing another GSF grade, or changing the SF1600-BN thickness, creates a new candidate combination that needs its own validation. Results from these cases do not extend automatically across either series — and GSF should not be assumed to be an insulating pad by default.
What the 280 W and 600 W Cases Actually Tell You
The application records describe real test data: the 280 W air-cooled module used 0.2 mm SF1600-BN, and the 600 W air-cooled module used 0.3 mm GSF90-03, both mounted on the heat-source fixture. Temperature performance reportedly matched or came close to the original grease schemes, and each pad handled more than 50 modules before replacement.
That gives both materials a working track record under their respective conditions. But reading “280 W” and “600 W” as usage ceilings ignores something basic: the heat-source area. Two stations can both be called “GPU heatsink module testing” and still ask very different things of the interface.
| Case Condition | 280 W Case | 600 W Case |
|---|---|---|
| Test head dimensions | 33 × 18.3 mm | 31.5 × 25.5 mm |
| Test area | Approx. 6.04 cm² | Approx. 8.03 cm² |
| Power / test area | Approx. 46.4 W/cm² | Approx. 74.7 W/cm² |
Computed from power and test-head dimensions, assuming the full input power passes uniformly through the nominal head area; bypass heat paths are not deducted.
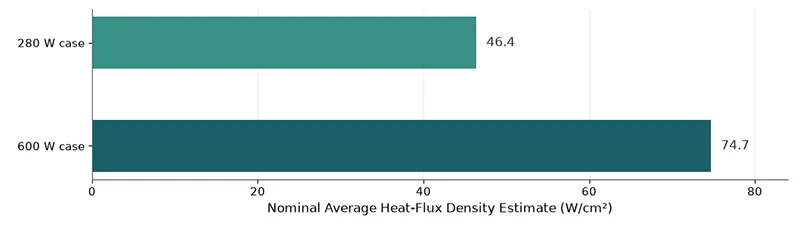
Figure 3. Nominal heat-flux density estimates for the two cases. The 600 W station works at roughly 1.61× the 280 W station's flux.
One more easily missed detail: the pad in the 280 W case measures 53 × 18.3 mm — larger than the test head itself. Outline coverage area is not effective heat-source area, so heat-flux density cannot be computed from the whole pad. Actual effective contact has to be confirmed against the fixture structure and contact state.
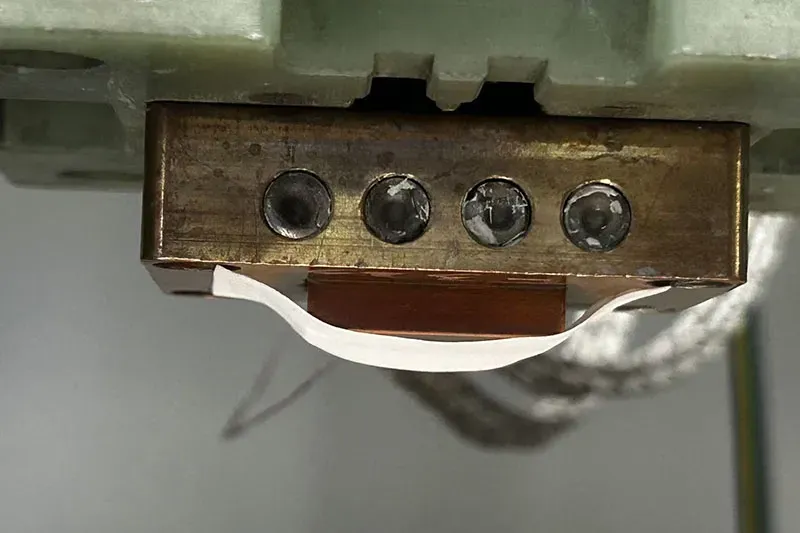
Figure 4. Heat-source copper fixture and pad from the SF1600-BN case.
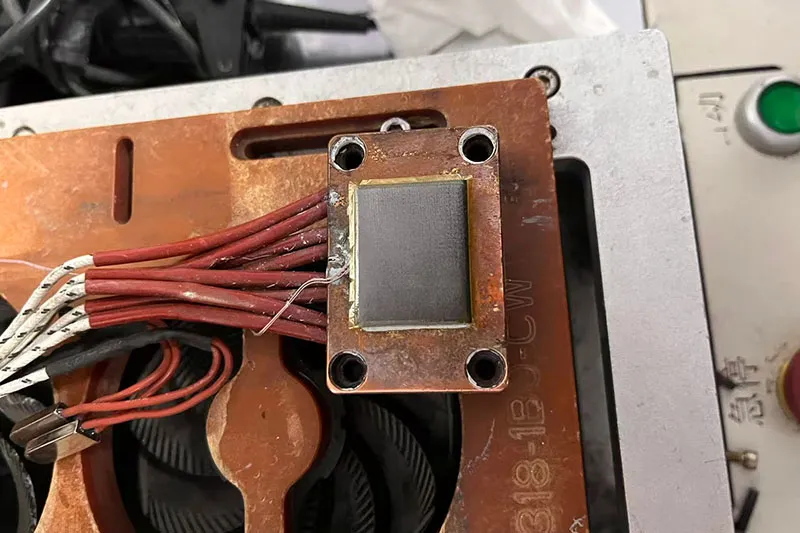
Figure 5. Fixture interface from the GSF90-03 case. The photo shows usage location only — it is not evidence of clamping pressure or conformance quality.
Switching From Grease: Five Steps Before the Line Changes Over
Step 1 — Keep the Grease Process as Your Baseline
Record the original scheme's power, airflow or liquid-cooling condition, starting temperature, loading force, temperature-measurement locations, and judgment timing — and keep representative good units, bad units, and samples near the specification limit. First establish how much product-to-product difference the equipment can currently resolve; only then set the offset and scatter the new interface is allowed to introduce.
Step 2 — Define the Thickness, Pressure, and Positioning Window
Clean off old residue, check the flatness of the fixture and VC contact surfaces, cut and position the pad to the actual contact zone, and re-verify closing travel and loading force. The same cylinder setting or the same press-head position does not guarantee the same contact pressure once the material changes.
Hunt for a stable-conformance condition within the load the VC allows — chasing low resistance by endlessly raising pressure is not a strategy. And “mounted on the fixture” in these cases does not mean double-sided tape is required; any extra adhesive layer should be evaluated separately for both resistance and fixing method.
Step 3 — Recalibrate and Verify the Judgment Boundary
In the recorded cases, Sheen calibrated three times with good and bad units before formal testing. Use that as the starting point; production release should add critical samples and repeated measurements on top.
Hold boundary conditions consistent and re-test the reference samples alternately under the same starting temperature or a predefined cooling rule. Watch the distributions, offsets, and overlaps of good and bad units under the old and new interfaces — not the average temperature of one good unit. The pass status of critical samples should be confirmed beforehand by a trusted reference method.
If the result is a stable systematic offset, threshold adjustment can be assessed through the quality process once correlation is confirmed. If random scatter grows, chase contact, positioning, or interface life first. Widening the judgment threshold to hide poor repeatability is not a fix — it's a quiet recall waiting to happen.
Step 4 — Confirm the Test Time Window
Compare heating curves, fixed-time temperature differences, and the metrics the original algorithm uses for judgment. For steady-state judgment, define the stability condition in advance; for fixed-time or transient metrics, keep the time window identical and confirm it still discriminates. A lower final temperature does not automatically mean the original test cadence still applies.
Step 5 — Build Traceable Replacement Rules
Continuously log test counts, reference-unit temperature drift, pad displacement, tearing, particle generation, and adhesion. Use the validated cycle count as the preventive-replacement basis, and set abnormal-condition triggers for early replacement on top of it.
One Checklist to Decide Whether the Replacement Is Ready
| Verification Target | Records to Keep | Release Basis |
|---|---|---|
| Thermal performance | Temperature offset, spread, and response time under identical boundaries | Meets the defined detection needs and error budget |
| Discrimination ability | Repeated test results for good, bad, and critical samples | False-accept, false-reject, and result overlap within allowed range |
| Mechanical contact | Loading force, closing travel, positioning, and VC surface condition | Load compliant; no unacceptable product damage |
| Continuous use | Reference-unit drift, cycle counts, surface integrity | Still meets requirements across the specified replacement period |
| Process recovery | Reference-unit results and operator consistency after pad change | Any pad change restores the test baseline repeatably |
This is an introduction-validation checklist, not a claim that the recorded cases completed every item. Specific limits, sample sizes, and retest frequency belong to the customer's quality requirements, detection capability, and risk assessment.
From Material Choice to a Verifiable Test Process
SF1600-BN and the GSF series give heatsink module testing two evaluable interface directions: the former pairs heat transfer with electrical insulation; the latter builds a vertical heat path for tighter interface-resistance budgets. Whether either replaces the incumbent grease comes down to what it proves on the actual fixture — stable heat transfer, preserved product discrimination, and repeatable use across the specified service period.
【Request a Custom Quote】If you are evaluating a grease replacement, provide Sheen with: test power, heat-source dimensions, fixture structure, allowable loading force, and the current judgment method. From those conditions, candidate thicknesses and materials can be shortlisted, then confirmed through reference-sample comparison and continuous testing.
Sheen Thermal
Dongguan Sheen Electronic Technology Co., Ltd · Founded in 2008
Manufacturer of thermal interface materials and silicone foam for automotive electronics, energy storage, power electronics, communications and consumer electronics.
Certified
- ISO 9001:2015
- ISO 14001:2015
- IATF 16949:2016
What we supply
- Thermal conductivity Up to 90 W/m·K
- Thickness 0.3–10.0 mm
- Custom & samples Die-cut to drawing, 3–7 days
LAST:Nothing