
 English
 usheenthermal

From Easy to Install to Easy to Trust: Our GSF Graphene Thermal Pads, Honestly Reviewed
Date:2026-11-19
You know the ritual. Remove the heatsink. Wipe off the old grease. Debate how much to squeeze on next time. If you build systems, swap coolers, or test devices for a living, you have done this more times than you care to count. A thermal pad you simply place to size promises a shortcut — but the pad's real exam begins the moment the heatsink comes down on it.
We sent GSF samples to customers and listened carefully. What came back was praise for easier installation and less cleanup — and honest worries about sliding, fragile thin sheets, and price. Temperature results varied too: some users saw performance close to their original grease, others a small improvement. For us, these details are exactly where an engineer or buyer should start judging a material's value:
| What Our Customers Noticed | What It Means for Your Selection |
|---|---|
| Easy placement, no spreading | Assembly and cleaning steps can be evaluated for simplification |
| Temperature close to grease, or slightly better | Contact and load must be verified on the same platform |
| Pad slides during installation | Size, positioning, and heatsink lowering method need to cooperate |
| Some pads intact after removal, some torn | Reusability must be validated against your actual rework process |
Our GSF series builds a through-thickness heat path with directionally aligned, laminated graphite, in conductivity grades of 75, 90, 110, and 130 W/m·K. But the reason to choose it has to land on your specific interface: can it make contact, can it work steadily, and does maintenance get easier. We would rather state the usage questions clearly first, then let test data answer them.
Customer feedback reflects individual experiences on different setups. We summarize it here without presenting it as a unified cooling promise.
Not Cooler After the Swap? First Check Whether the Heat Path Connected
The same pad can change its temperature story on a different cooler. Cold-plate flatness, package warpage, mounting stops, and load distribution all shape contact — and if contact never forms, a high conductivity number is just a well-dressed spectator.
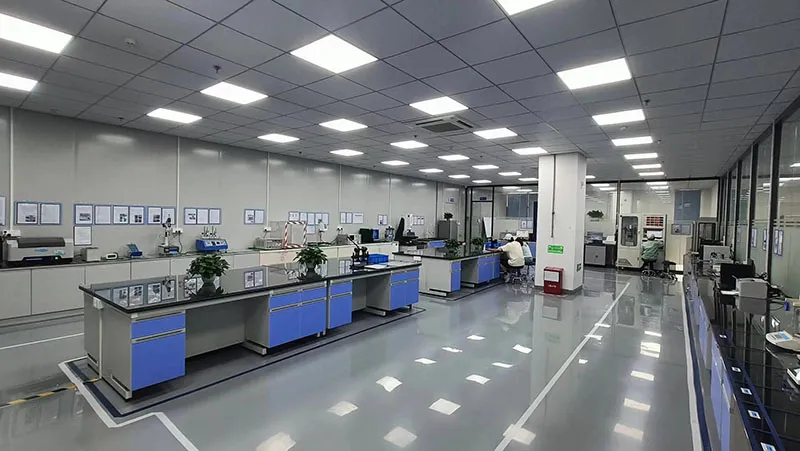
Figure 1. One of Sheen technology testing workshops. The ASTM D5470 test report is from Sheen’s internal laboratory.
Two of our ASTM D5470 reports on GSF110-020 show this relationship plainly. At 50 psi, the two tested samples measured 0.052 and 0.051 °C·cm²/W — nearly twins. At low pressure, the two samples pulled noticeably apart.
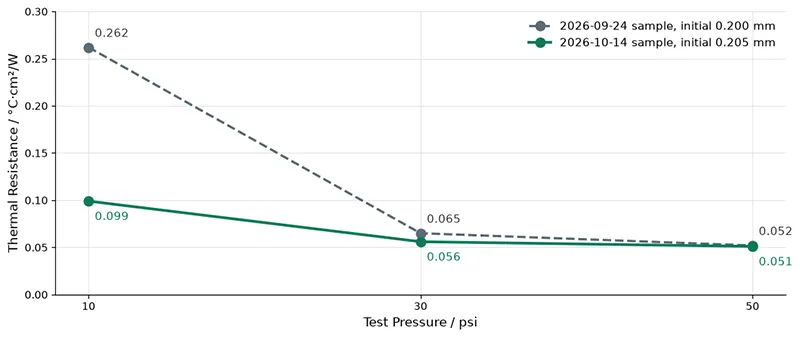
Figure 2. Pressure vs thermal resistance from two GSF110-020 reports. Connecting lines aid reading only — they are not predictions at untested pressures.
This is why we never recommend selecting by a single lowest resistance value. What you actually need is performance at the pressure your device can provide, and the material's working thickness at that pressure. The gap between the two samples also tells us low-pressure behavior deserves a re-test; the existing reports alone cannot explain the difference.
Turn Measurement Into a Useful Comparison
When you compare materials, hold these steady: ambient temperature, the cooler, fan or pump settings, load power, and the installation procedure. Watch steady-state temperature, hotspots, and any throttling. One customer combined a pad swap with a water-cooling upgrade and saw roughly 20 °C lower temperatures overall — since the cooler changed too, we do not attribute that drop to the pad.
50 psi is a test condition, not an installation instruction. Your real clamping force should be decided within what the chip package, PCB, and heatsink allow. Please do not keep tightening screws chasing a report value.
0.2 mm or 0.3 mm? You Are Choosing a Working Interface
Thinner is not automatically better. Thicker does not automatically seal better either. A pad on the thin side may still not reach after the stops land; one on the thick side may shift heatsink height or load distribution. Confirm the assembly gap first, then pick the supply thickness — that order saves trial-and-error.
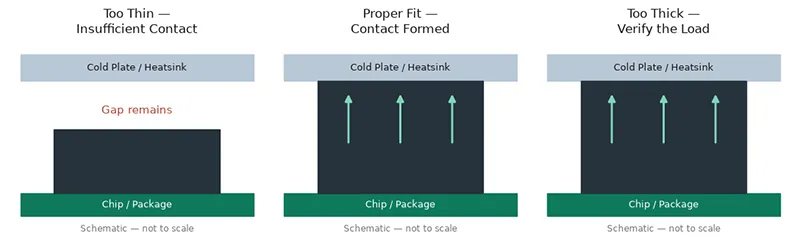
Figure 3. Thickness vs contact, schematic for selection logic — it does not represent any specific product's deformation mode.
Take the GSF110-020 sample dated 2026-10-14: initial thickness 0.205 mm, compressed to 0.176 mm at 30 psi, and 0.157 mm at 50 psi. A nominal 0.2 mm does not promise the same pressure and resistance in every assembly gap. Here is the screening table from the model TDS documents:
| Candidate Model | Supply Thickness | Conductivity Grade | Resistance Spec & Condition |
|---|---|---|---|
| GSF110-020 | 0.20 ± 0.02 mm | 110 W/m·K | ≤0.06 @50 psi |
| GSF110-030 | 0.30 ± 0.03 mm | 110 W/m·K | ≤0.08 @50 psi |
| GSF130-030 | 0.30 ± 0.03 mm | 130 W/m·K | ≤0.06 @50 psi |
Table 1. Screening information from model TDS documents. Resistance unit: °C·cm²/W; spec limits and single measured values are used as labeled. Test reports and TDS documents describe thickness tolerance differently — incoming inspection should follow the version both parties confirm.
If your structure is fixed at 0.3 mm, GSF110-030 and GSF130-030 give you two grades to compare. If the interface is narrower and tolerance is under control, GSF110-020 deserves priority evaluation. A model's value lies in matching the assembly conditions — then letting your own device test confirm the gain.
Your Grease Goes On Perfectly. Why Try a Pad?
Fair question. Look at the photo on the left: grease covering most of the contact zone, nice and even. We have no argument with that — on day one. The question arrives with the next assembly, a different operator, or the tenth rework: dosage, spreading technique, and coverage all have to be controlled again, every single time. A new GSF Graphene pad of the same spec always starts from a defined supply thickness and tolerance; your assembler positions it to size, and the on-site metering and spreading simply vanish.
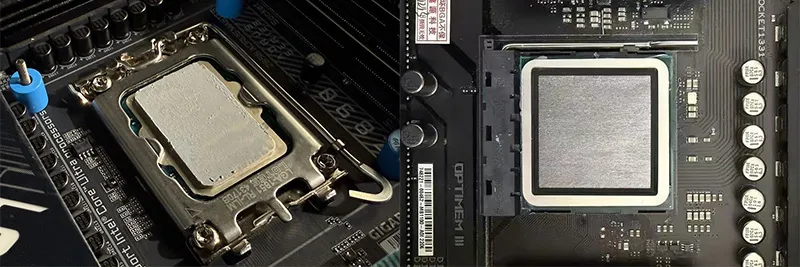
Figure 4. Assembly photos of the two materials (customer-provided). Left: grease applied — even appearance, but dosage and coverage must be controlled at assembly. Right: pad placed — select to spec and position, no on-site metering or spreading. Final interface thickness and thermal performance must be measured on the same platform, load, and cooling conditions.
Supply Thickness and Compressed Working Thickness Are Two Different Numbers
GSF110-020 ships at 0.20 ± 0.02 mm. In one published test, a sample with an initial 0.200 mm compressed to 0.171 mm at 30 psi and 0.149 mm at 50 psi. Once you lock the right spec, every assembly starts from a controlled supply thickness — while the working thickness still depends on your real gap, allowed pressure, and contact state.
For stations with rotating operators, batch assembly, or frequent rebuilds, we suggest using your current grease as the baseline. Record per-assembly time, steady-state hotspot temperature, and temperature drift across repeated assemblies. When temperatures come out comparable, the assembly and cleaning hours you save become a concrete argument for your purchasing team.
Skip the Paste Step — but Do the Placement Right
“Just lay it down and mount” is exactly why customers love pads. “The pad slid away before the heatsink even pressed down” is also real feedback. For a thin graphite pad, positioning is not a trivial step: drift, wrinkles, or edge damage all eat into effective contact. Our recommended handling sequence:
- Clean the contact surfaces, then size the pad to the effective contact zone.
- Handle by the edges; avoid stretching and repeated folding.
- Lower the heatsink as vertically as possible — no sideways dragging across the pad.
- Tighten evenly per the device requirements.
- If a release liner is present, remove it per the supply instructions.
Feedback on thin-sheet toughness is not uniform: some users disassembled and kept pads intact; others worried about tearing. That tells us handling methods must be validated together with product version, shape, and your assembly process. For mass production, die-cut-to-print, pick-and-place method, positioning fixtures, and packaging protection should all be settled during the sample phase. And when something goes wrong, check in this order:
| Symptom in Use | Check First |
|---|---|
| Temperature high right after install | Drift or wrinkles; whether contact impressions are complete; whether stops prevent mating |
| Pad slides during mounting | Lowering direction; positioning structure; pad size and handling posture |
| Sticking or tearing on removal | Shutdown and disassembly procedure; separation method; material integrity |
| Edges near components or solder joints | Drawing boundaries; electrical isolation requirements; debris cleanup |
Settle Electrical Isolation Before Assembly
Customers have asked us directly about the risk of a conductive sheet touching nearby components — and they are right to ask. Current GSF documentation provides no dielectric-strength data usable for insulation design, so do not treat it as an insulating pad. Around bare dies, dense SMD areas, and any interface with insulation requirements, confirm material suitability and the isolation structure in advance. One more request from our engineers: never fix the effective thermal surface with glue, tape, or extra grease on your own. Any auxiliary material changes the interface conditions — confirm the plan first, then test thermal performance.
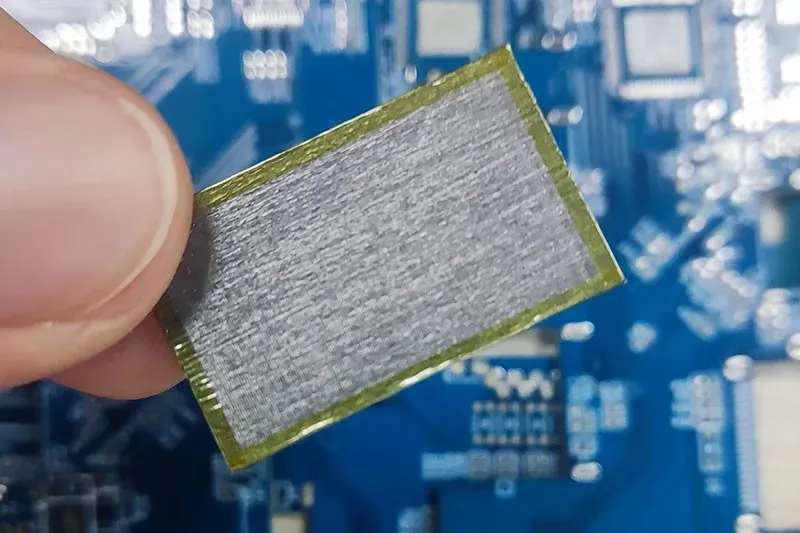
Figure 5. Sheen Graphene Thermal pad with edge sealed. Edge-sealing is primarily used to address the issue of graphene material shedding particles; it cannot serve as a form of electrical insulation.
After Removal, After Aging: Watch the Change, Not Just the Start
Skipping grease cleanup is a convenience you feel immediately. Reuse adds a judgment call: after removal, is the sheet intact — and does it still make contact when remounted? Trial feedback includes successful repeated assemblies and worries about adhesion and damage after thermal cycling. Both are real.
Our GSF90 performance report records a 93% recovery rate, with a test procedure of 50% compression deformation, 30 minutes held, then 10 minutes of rest after unloading. Read that carefully: it shows the tested sample can recover from deformation — it does not mean recovery to 93% of initial thickness, and it does not equal a number of allowed reuses. For high-frequency rework stations, inspect tearing, contamination, wrinkles, and debris at your planned operation count, and re-measure resistance. Only when integrity and performance both hold does “less cleaning” become a real benefit.
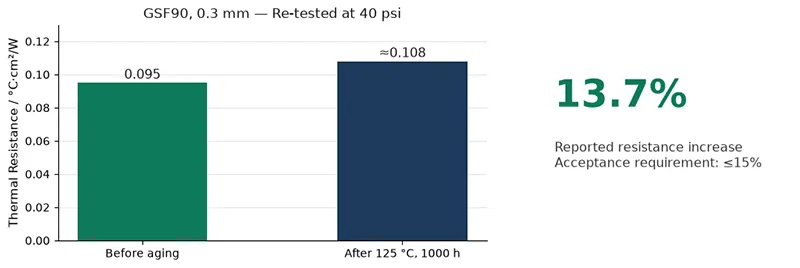
Figure 6. GSF90 0.3 mm aging reference. Pre-aging value 0.095; the ≈0.108 post value is converted from the reported increase, shown for illustration only.
In that report, a 50 × 40 × 0.3 mm sample spent 1000 hours at 125 °C, then measured at 40 psi — resistance rose 13.7%, inside the report's ≤15% acceptance requirement. This is a reference point for high-temperature stability evaluation. It does not convert into a device lifetime, and it does not automatically represent other GSF models. The same report records an oil-bleed rate of 1.91% — so “low maintenance” must never be written as “zero bleed.” For optics or cleanliness-sensitive applications, evaluate against your actual structure. We publish these test bases precisely so your discussions have a concrete starting point.
Where We See These Pads Earning Their Keep
From desktop-CPU installation feedback, we can distill shared questions — pressure, positioning, cleaning, rework. Step into industrial applications and device sizes, heat flux, and reliability demands all change. The directions below are where we believe the GSF series deserves validation — not completed customer or system certifications:
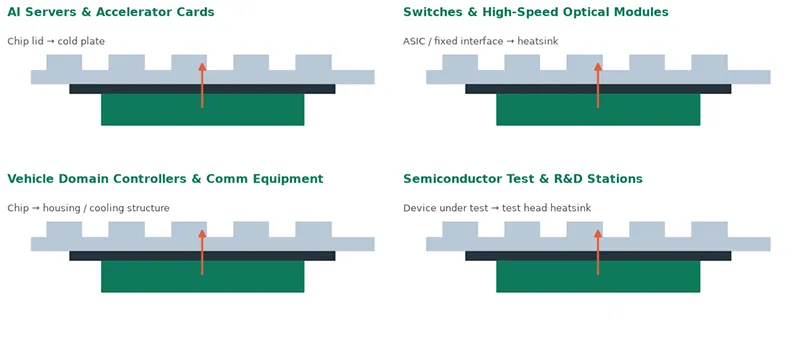
Figure 7. Interface positions in four application scenarios. Schematics only — not actual device dimensions or deployments.
| Evaluation Scenario | What Engineers Should Watch Most | Selection Starting Point |
|---|---|---|
| AI servers — GPU, CPU, accelerator cards | Large contact area, warpage, load distribution, hotspots | GSF110-020 / GSF130-030, screened by gap |
| Switch ASICs & fixed interfaces of high-speed optical modules | Limited space, local temperature rise, electrical isolation, cleanliness | GSF90 / GSF110 / GSF130, verified by structure |
| Vehicle domain controllers & communication equipment | Thermal cycling, vibration, environmental aging, contact retention | Screen by gap, add corresponding reliability tests |
| Semiconductor test & R&D stations | Compression cycles, wear, debris, test repeatability | Start with repeated-compression and resistance-retention validation |
One distinction we ask you to keep in high-speed optical modules: fixed contact vs sliding pluggable interfaces. Fixing a chip to a cooling structure can be evaluated around pressure and thickness; where sliding friction exists, wear, particles, and contact life need validation too. Test stations likewise cannot substitute a single rebound result for long-term compression validation.
You Are Buying a Repeatable Result, Not Just a Sheet
Customer opinions on price differ — some value less cleaning and easier assembly; others feel that when temperatures match grease, the pad's price needs a fuller justification. Honestly, we agree with both. And we think the question deserves an answer built on the whole process, not the unit price:
- Cutting scrap.
- Assembly cycle time.
- Positioning yield.
- Replacement ratio after disassembly.
- Maintenance labor hours.
Sheets may simplify your process — but until these records exist, we will not promise your total cost drops. That is a promise only your own numbers should make.
Make One Sample Round Produce a Clear Conclusion
From engineering, bring contact-surface dimensions, flatness or warpage data, gap and tolerance, allowed pressure, power dissipation, and target temperatures. From purchasing, confirm model, size tolerance, packaging, delivery batches, and acceptance conditions. Then use your current material as the baseline and compare initial performance plus repeated-installation results on the same equipment.
If the first test misses the target, separate the cause first: contact, structure, or material grade. If temperatures match but cleaning got easier, keep measuring labor hours and scrap. Step by step around real benefits — that is how “we tried a pad” becomes “we know why we use it.”
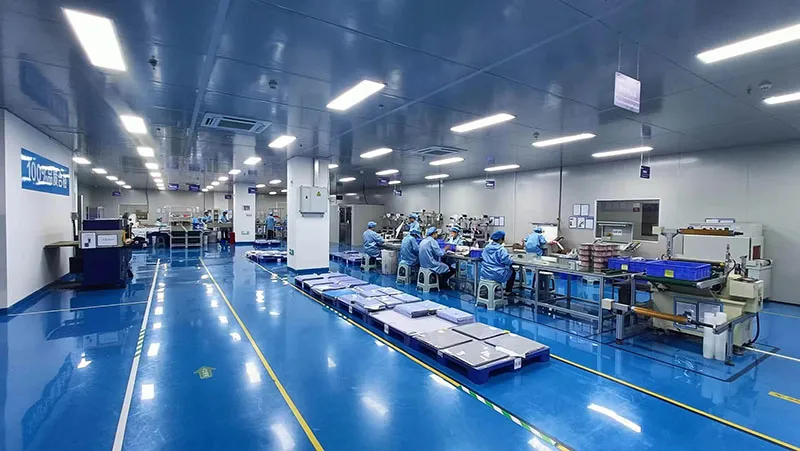
Figure 8. One of Sheen Technology production workshops. The image shows actual operating conditions in a Sheen production workshop.
Our GSF series graphene thermal pad gives thin, high-power interfaces an evaluation path from model TDS to sample testing. Bring your current material and interface drawings, and ask us about the matching models and samples — let us settle contact, temperature, and maintenance in the same validation round.
Product consultation and sample evaluation: https://www.sheenthermal.com/feedback.html
Sheen Thermal
Dongguan Sheen Electronic Technology Co., Ltd · Founded in 2008
Manufacturer of thermal interface materials and silicone foam for automotive electronics, energy storage, power electronics, communications and consumer electronics.
Certified
- ISO 9001:2015
- ISO 14001:2015
- IATF 16949:2016
What we supply
- Thermal conductivity Up to 130 W/m·K
- Thickness 0.3–10.0 mm
- Custom & samples Die-cut to drawing, 3–7 days
LAST:Nothing