
 English
 usheenthermal

Thermal Pad Hardness: Why Higher Conductivity Isn't Enough
Date:2026-10-28
If you’ve ever selected a thermal pad, this will sound familiar. You spec a higher conductivity, and system temperatures don’t budge. You switch to a softer material and temperatures improve — but placement on the line becomes a wrestling match. Or early tests pass, and after aging, contact has quietly changed. None of these problems gets solved by tweaking a single hardness number. Hardness, thickness, contact area, structural stiffness, and assembly pressure together decide whether a pad forms a stable heat path.
The goal of hardness selection is simple to say and tricky to do: fill the gap and achieve full contact within the component’s allowable load, while meeting assembly, insulation, and long-term use requirements. For the Sheen SF series, the right order is: screen the conductivity grade and material family first, then compare hardness versions within the same series. Don’t map an industry to a fixed hardness — “servers take Shore 00 60” is not a thing.
1. What Hardness Can Actually Tell You
Hardness measures a material’s resistance to local indentation. Shore 00, Shore A, Shore C, and Asker C are different measurement systems — their numbers cannot be compared directly. A purchase spec that just says “hardness 40” is incomplete. Write down the scale, tolerance, test method, specimen thickness, whether layers were stacked, and the reading time. A thin sheet measured on a hard backing plate won’t read the same as a block specimen under other conditions, either.
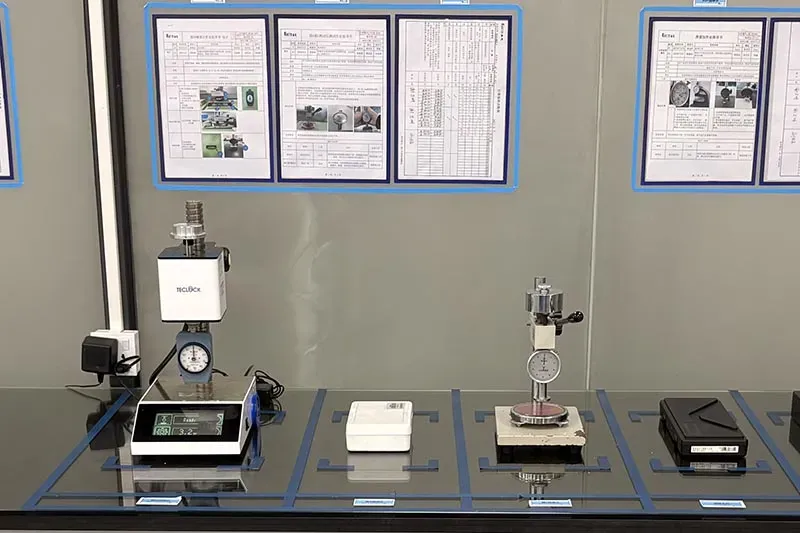
Figure 1. Sheen Technology Laboratory difference Hardness test equipment
Within the same formulation family, lower hardness generally helps surface conformity and lowers assembly stress — but the final verdict still comes from the compression stress curve. Two different formulations, both Shore 00 40, can behave very differently under full-area compression. And hardness says nothing directly about recovery speed, tear resistance, long-term thickness retention, or low-bleed behavior. Confirm each of those separately.
| Comparison Direction | What It May Offer | What to Check Carefully |
| Lower hardness within the same series | Better conformity at low loads and on uneven surfaces | Stretching during pick-up, placement drift, teardown damage, over-compression |
| Higher hardness within the same series | Some formulations handle better and hold dimensions | Force needed to reach target compression, board bending, insufficient contact |
| Same hardness, different formulations | Independently optimized conductivity, insulation, or low-bleed needs | Don’t assume identical compression force, thermal resistance, or aging behavior |
Table 1. Comparison directions for candidate samples — not a substitute for compression and thermal testing of specific grades.
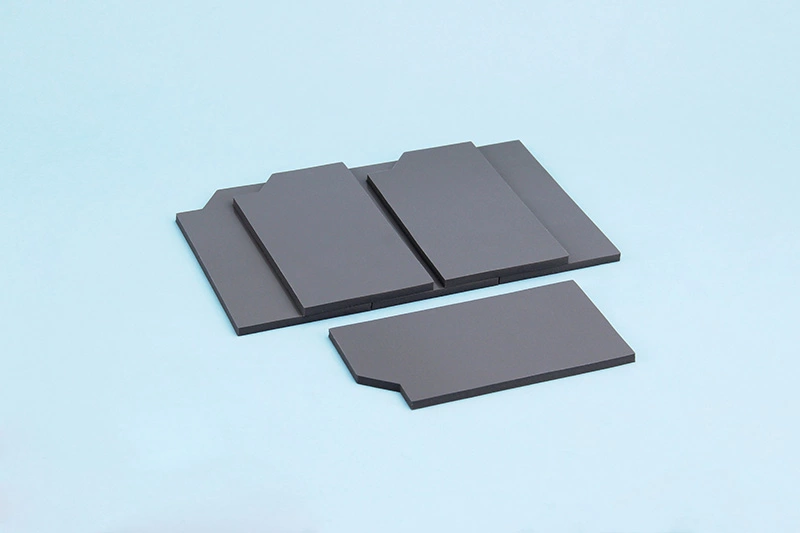
Figure 2. Sheen SF600G series thermal pad product photo.
2. Establish the Thickness-and-Load Window First
Your selection inputs should include at least: heat source location and size, power, upper and lower gap limits at every location, pad contact area, allowable component load, fastening method, operating temperature, and electrical requirements. Gaps should be measured in the intended assembled state — accounting for component height, housing flatness, heatsink tilt, and PCB deformation. Measuring loose parts once can badly underestimate local changes after fasteners are torqued down.
Let the uncompressed thickness be t₀, the assembly gap g, and compression rate c. Then c = (t₀ − g) / t₀. If you set a target compression first, estimate with t₀ = g / (1 − c). Then come the two limit checks that everyone skips and later regrets:
- Largest gap × thinnest pad — does contact still happen?
- Smallest gap × thickest pad — does compression or load exceed the limit?
Just taking the maximum gap and “adding a little margin” is not a method.
| Tolerance Check Item | Example Input | Result |
| Actual gap range | 0.75–0.85 mm | Must cover all assembly locations |
| Candidate uncompressed thickness | 1.00 ± 0.05 mm | Thinnest 0.95 mm, thickest 1.05 mm |
| Minimum compression rate | (0.95 − 0.85) / 0.95 | 10.5% |
| Maximum compression rate | (1.05 − 0.75) / 1.05 | 28.6% |
Table 2. Dimensions and tolerances are design calculation examples, not Sheen’s standard supply tolerances. 10.5%–28.6% is not a universal recommended compression range.
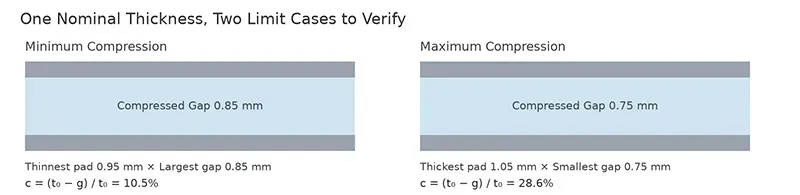
Figure 3. Two compression limit cases at the same nominal thickness, calculated with the example dimensions.
Next step: ask your supplier for compression stress data at the specific hardness, thickness, and test conditions, and check whether the window above allows both full conformity and component-safe loading. If minimum compression is insufficient while maximum is already too high, a single pad thickness has no viable window — time to adjust local thickness, add structural stops, or rethink the material.
For loads, start with F = pA. At 100 kPa average pressure, a 20 × 20 mm contact area means about 40 N; 40 × 40 mm means about 160 N. Quadruple the area, quadruple the force — so a “big soft pad” can still bend a board noticeably. With multiple pads compressed at once, estimate each zone’s reaction force and their sum, and check what the resulting moments do to the housing and PCB.
This is only a first-pass uniform-pressure estimate. Screw torque depends on friction, fastening sequence, structural stiffness, and preload distribution — you can’t convert it from area or hardness. For fragile packages, control actual force with stops, springs, or load measurement, and treat component and system limits as the binding constraints.
3. Match Conductivity and Hardness Separately
Sheen SF600, SF600G, and SF1200 offer different conductivity grades; SF500-FG adds a fiberglass-carrier process option. Their hardness ranges overlap — which tells you something important: a higher conductivity grade does not automatically mean higher hardness. Compare thermal budget, load, and handling requirements together, then decide the sampling combination.
| Grade | Conductivity W/m·K | Hardness Range, Shore 00 | Thickness Range mm | Area-Normalized Resistance °C·in²/W |
| SF600 | ≥5 | 30–90 | 0.5–10 | ≤0.35 |
| SF500-FG | 3.5 | 35–90 | 0.5–5 | ≤0.35 |
| SF600G | 6 | 35–90 | 0.5–5 | ≤0.24 |
| SF1200 | 12 | 35–90 | 0.5–5 | ≤0.11 |
Table 3. Resistance test conditions: 1 mm, 50 psi, ASTM D5470; 50 psi ≈ 345 kPa. Hardness values are series ranges — not every hardness version shares the same resistance.
A sensible sequence: build an assembly baseline with SF600; if the temperature-rise margin comes up short, compare SF600G or SF1200 under the same thickness, contact area, and load constraints. For thin sheets, high-aspect-ratio die-cuts, or automated placement, add SF600-FG to the evaluation — but a fiberglass carrier doesn’t automatically buy you creep resistance or lower resistance. Grade, carrier, and surface treatment must all match the tested samples.
4. Why Higher Conductivity Doesn’t Always Mean Lower Temperatures
Total interface resistance is roughly: source-side contact resistance + pad bulk resistance + sink-side contact resistance. Bulk resistance can be estimated as R = t / (kA), where t is compressed thickness, k is conductivity in the relevant direction, and A is effective heat-transfer area. Real area and contact resistance also shift with pressure, surface condition, and deformation.
Quick worked example: compressed thickness 0.80 mm, effective area 20 × 20 mm, uniform 1D heat flow assumed. At k = 6 W/m·K, bulk resistance ≈ 0.333 K/W; at k = 12, ≈ 0.167 K/W. Push 10 W through that path and the bulk temperature drops are about 3.33 °C and 1.67 °C respectively. Pure theory — contact, package, and heatsink resistances not included, and definitely not a promised temperature improvement from swapping grades.
Thickness matters just as much. All else equal, a thicker bulk layer raises resistance. So don’t paper over a structural design problem with an over-thick pad and then hope a higher k-value rescues you. The right move: within tolerance and load limits, use the thinnest interface that still makes stable contact.
One unit trap worth repeating: catalog values in °C·in²/W are area-normalized, not system-level °C/W. When comparing, verify thickness, pressure, method, and contact conditions. Never extrapolate 50 psi data onto a low-clamp-force structure, and never treat results across different hardnesses, carriers, or added adhesives as one spec.
5. How Different Applications Trade Off Hardness
An application name hints at risks; the actual choice still comes back to gap and force constraints. The scenarios below are starting points for a discussion with Sheen engineers — not direct grade assignments.
Thin PCBs and Low-Clamp-Force Structures
Small sensors, plastic housings with snap-fits, and thinner control boards are usually force-limited first. Start by comparing lower-hardness versions within a series, and check the reaction force at your target compression. After going softer, watch whether the pad stretches in handling, lifts off with the release liner, or shifts after the housing is closed. A soft material that deforms out of coverage during assembly can still cause local hot spots.
Laptop VRAM and Power Delivery Components
When one heatsink spans multiple components, height differences and board bending often matter more than the average gap. Measure VRAM, MOSFETs, and every other cooled location separately; use zoned thicknesses if needed instead of one thick pad over everything. Don’t let the tallest component prop up the heatsink while shorter ones starve for contact. And the thin CPU/GPU lid-to-cold-plate interface deserves its own evaluation of grease or phase-change materials — don’t lump it in with the surrounding gap-filling zones.
Server Power Supplies and Industrial Control Modules
For screw-fastened chassis heat paths, check component tops, housing flatness, and fastening sequence together. Build the comparison from SF600 or SF600G; tighten the thermal budget and higher grades enter the picture. Where compression areas are large, confirm total reaction force first — using screws does not grant you permission for high hardness and heavy compression by default.
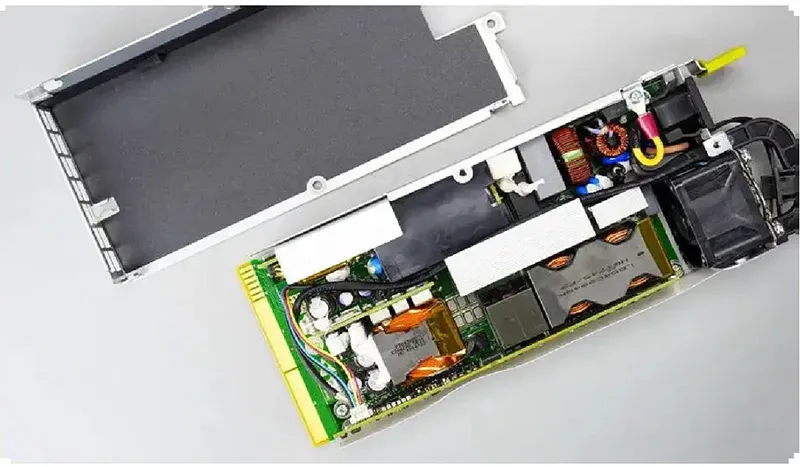
Figure 4. Power module application image from Sheen’s website server page — illustrating the application scenario only, not proof of any specific grade installed at a customer.
Automotive Electronics and Energy-Storage Control Units
OBC, BMS, and domain controllers juggle temperature swings, vibration, insulation, and long-term contact stability. “Automotive is harsh” does not logically conclude “choose harder.” Large-area interfaces may need tighter control of compression reaction force; local hot components need attention to concentrated heat flow. And a thermal pad should never be assumed to provide structural support or fastener anti-loosening — those jobs belong to structural design and dedicated validation.
6. Special Requirements Need Independent Validation
Optics, imaging, and certain sensor locations can be sensitive to siloxane or bleed-out contamination — that’s where Sheen’s AF non-silicone series enters as a separate evaluation. After switching material families, don’t carry over the SF series’ hardness, compression, or resistance conclusions. Re-check temperature behavior, compatibility, volatiles, and assembly performance. “Non-silicone” also doesn’t mean compatibility with every contaminant or neighboring material has been proven.

Figure 5. Sheen Technology AF Non-Silicone Thermal pad.
For automated placement, hardness is only one process variable. Liner release force, single- or double-sided tack, die-cut web design, pick-up area, and pad shape all affect yield. If soft pads wrinkle during pick-up, optimize packaging, liners, and support first — then compare whether higher hardness is even needed. Harder is not the only wrench in the toolbox.
When electrical insulation is required, distinguish breakdown voltage (kV) from dielectric strength (kV/mm). Don’t linearly extrapolate a breakdown result at one thickness to all thicknesses; check the thinnest compressed location, surface defects, and withstand-voltage behavior after aging. UL94 V-0 describes flame rating and RoHS describes restricted-substance compliance — neither substitutes for system-level insulation design.
7. Tell Long-Term Deformation Apart from Stress Changes
Compression set, stress relaxation, and creep are three different animals:
- Compression set — residual thickness change after unloading and the specified recovery period.
- Stress relaxation — reaction force decaying over time at fixed compression displacement.
- Creep — deformation gradually increasing under constant load.
A quick finger squeeze or one hardness reading evaluates none of them. Fixed-gap and constant-load structures also age differently: with housing stops, pad thickness is structurally controlled but contact pressure may drift; spring-loaded structures add displacement that follows material deformation. Stress relaxation doesn’t necessarily mean thermal failure, and retained thickness doesn’t guarantee adequate interface pressure. The verdict comes from re-measuring contact state and thermal performance.
| Observed Symptom | Check First | Validation / Improvement Direction |
| High temperature rise on first assembly | Thickness, insufficient compression, surface contamination, coverage position | Inspect assembly imprint, then compare resistance under identical conditions |
| Obvious board bending after fastening | Total area reaction force, local hard spots, fastening sequence | Measure load and displacement; evaluate lower-stress versions or stops |
| Temperature rise increases after aging | Contact changes, material migration, structural deformation, contamination | Combine teardown inspection with thermal re-measurement to locate the cause |
| Wrinkling in placement or damage in rework | Release force, pick-up method, tack, die-cut shape | Optimize release and support; compare carrier options |
Table 4. Suggested troubleshooting order. Every symptom above can have multiple causes — don’t reflexively blame hardness.
For low oil-bleed, low-volatility, and long-term recovery requirements, define the evaluation conditions and acceptance criteria explicitly. Fiberglass or other carriers help certain handling needs but can’t substitute for formulation aging and reliability evidence. Oil bleeding, squeeze-out, or contact changes should be verified under the corresponding conditions — not inferred from softness.
8. From Sample Comparison to Production Sign-off
Control your variables when sampling. Example: within the same SF series, compare Shore 00 40 and 60 candidates while holding thickness, outline, carrier, and surface treatment constant. Those two points are test points, not a universal recommended range. Record peak load at design gap, load after hold, compressed thickness, and temperature rise — change thickness and formulation at the same time and you’ll never know where the improvement came from.
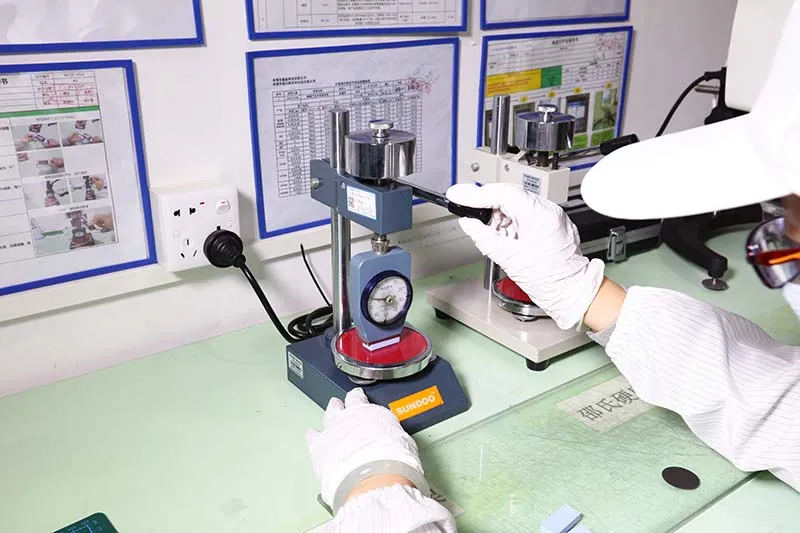
Figure 6. Sheen Technology Laboratory Thermal pad Shore 00 Hardness testing
Thermal tests should fix power, ambient temperature, airflow or coolant conditions, sensor positions, and the steady-state criterion. When judging interface improvements, log both heat source and heatsink temperatures — watching a single point can smuggle in fan-policy or other heat-path changes. Use consistent procedures for teardown, surface cleaning, and reassembly, and use repeat samples to gauge variation.
| Stage | Question to Answer | Suggested Records |
| Assembly validation | Contact without overload at both tolerance extremes? | Gaps, thickness, reaction force, board bending, imprint, appearance |
| Thermal validation | Meets temperature-rise budget under target conditions? | Power, boundary conditions, sensor positions, steady-state rise |
| Life validation | Interface still effective after long-term use? | Thermal cycling / aging conditions and before-after thermal changes |
| Production confirmation | Can volume supply repeat sample results? | Full part number, hardness & thickness tolerances, carrier, tack |
Table 5. Test durations, cycle counts, and acceptance limits for each stage should be set by project conditions and customer requirements.
Long-term testing should cover not just material coupons but representative structures and worst-case gaps. Products with vibration, rework, low-bleed, or high-insulation requirements get their own dedicated validation. And if a pad is visibly imprinted, contaminated, or torn at rework, follow the validated process — don’t assume reuse delivers the original performance.
9. Common Selection Questions
Within the same conductivity grade, is softer always better?
Choose the version that forms stable contact within the allowable load and suits your assembly. Softer may conform better but complicates pick-up and rework; harder may handle better but demands enough contact pressure. It’s a fit, not a ranking.
Does more compression always mean better cooling?
More compression can improve contact and thin the heat path — but the gain must be confirmed on the actual resistance curve. Beyond structural or material limits you risk overload, lateral squeeze-out, and other reliability problems. The lowest short-term temperature rise is not the only goal.
Can I stack two pads instead of one thick pad?
Stacking adds a middle contact interface, plus risks of slippage, air gaps, and assembly deviation. Unless specifically validated, prefer a single pad at the design thickness. Adhesive-backed versions are also a separate state — don’t borrow the no-adhesive resistance data.
What should I send Sheen when requesting samples?
【Request a Custom Quote】Include heat source size and power, upper and lower gap limits, allowable total force or pressure, operating temperature, insulation and low-bleed requirements, placement method, and expected service life. Write the candidate series, hardness, thickness, carrier, and tack into one spec with matching test conditions — that’s how “chosen well” becomes a reviewable, manufacturable design.
Sheen Thermal
Dongguan Sheen Electronic Technology Co., Ltd · Founded in 2008
Manufacturer of thermal interface materials and silicone foam for automotive electronics, energy storage, power electronics, communications and consumer electronics.
Certified
- ISO 9001:2015
- ISO 14001:2015
- IATF 16949:2016
What we supply
- Thermal conductivity Up to 90 W/m·K
- Thickness 0.3–10.0 mm
- Custom & samples Die-cut to drawing, 3–7 days
LAST:Nothing