
 English
 usheenthermal

20W Optical Module Liquid Cooling: CSF20-HR Carbon Fiber Thermal Pad Application Cases
Date:2026-11-20
Sliding an optical module into a switch takes one quick push — and that is exactly where the subtle work hides. Inside the cage, the module presses up against a copper block that can move. This motion repeats across a whole row of modules, and every slot's gap is slightly different. Too loose, and the copper block never really mates. Too tight, and the module fights you on the way in.
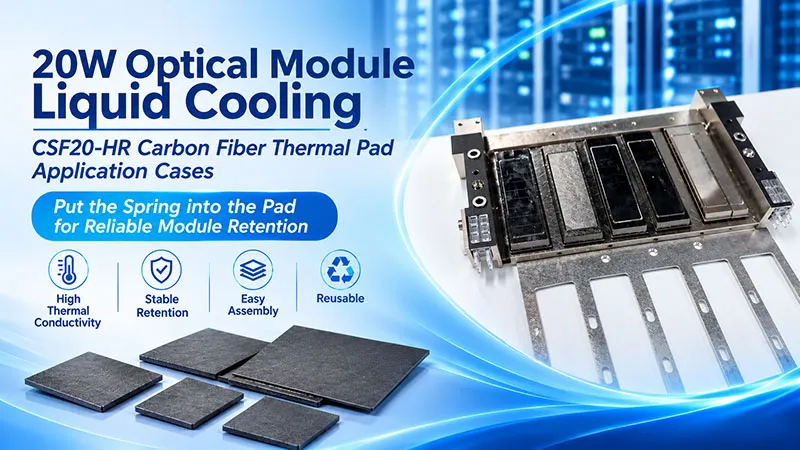
In two of our production cases, the designers built the spring into the pad itself. Here is how it works. The copper block sits in a groove at the bottom of the cold plate. When the module slides in, a wear-resistant coated steel sheet gives it a smooth contact face, and a thin phase-change layer fills the microscopic gaps between the steel sheet and the copper block. The moment the copper block lifts, the carbon fiber pad behind it compresses — then pushes the block back against the module. The groove steers left and right; the pad drives up and down. The same structure that conducts heat also absorbs the assembly gap into the pad's compression.
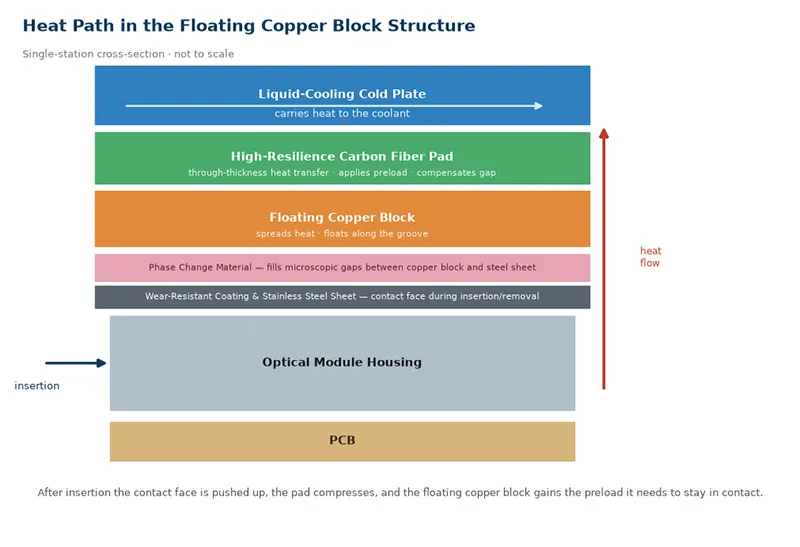
Figure 1. Floating copper block structure. The green layer is the high-resilience carbon fiber pad inside the cold-plate groove.
That is what “putting the spring into the pad” means. Once the block's travel, assembly load, and aged retention force all pass validation, the groove and pad take over a job that used to need separate guide pins and springs. Both a liquid-cooling system vendor (call them Y) and a liquid-cooling module maker (S) have carried this material-and-cold-plate structure into mass production. The disclosed reference duty from the case material: a six-position cold plate on top of the switch, 20 W per port, with a 1U platform running 32 ports.
Same Position, Five Materials — Why Only One Does the Job
Ask only “can it conduct heat?” and all five candidates raise their hands. Put the copper block back into its groove and ask “how much gap can it fill, and how much force can it still hold months later?” — and the division of labor finally shows. Here is how we read each one in this exact spot:
- Thermal grease is brilliant at thin gaps. Under external clamping, it levels microscopic pits in the contact faces. But behind a floating copper block, sustained preload has to come from somewhere else in the structure — and under thermal cycling you must watch pump-out and dry-out for the specific formula. Near optical faces, check whether silicone-oil exudates can migrate and deposit.
- Ordinary silicone pads compress readily and absorb assembly tolerance — but under constant compression their holding force can sag with time. “How much thickness comes back after removal” and “how much force remains while installed” are two different questions, answered by compression set and stress relaxation respectively.
- Phase-change material is superb at leveling thin gaps: it wets the contact face at operating temperature and fills existing small voids. Our case even uses a PCM layer between the copper block and the steel sheet. For vertical mounting or repeated thermal cycling, evaluate edge migration per the specific formulation.
- Graphite sheet spreads heat sideways beautifully — some grades exceed 1,000 W/m·K in-plane, but that number runs along the surface. In this cold plate, heat must climb upward through the pad, so look at the through-thickness figure and the compressible travel, not the in-plane headline.
- A vertically oriented carbon fiber pad handles conduction and preload at once. Fibers align through the thickness — straight along the module-to-cold-plate path. Our CSF20-HR TDS lists 20 W/m·K through-thickness conductivity (ASTM D5470), Shore 00 hardness 45–55, and ≥80% recovery. At assembly, confirm how much force it retains against temperature, compression, and time.
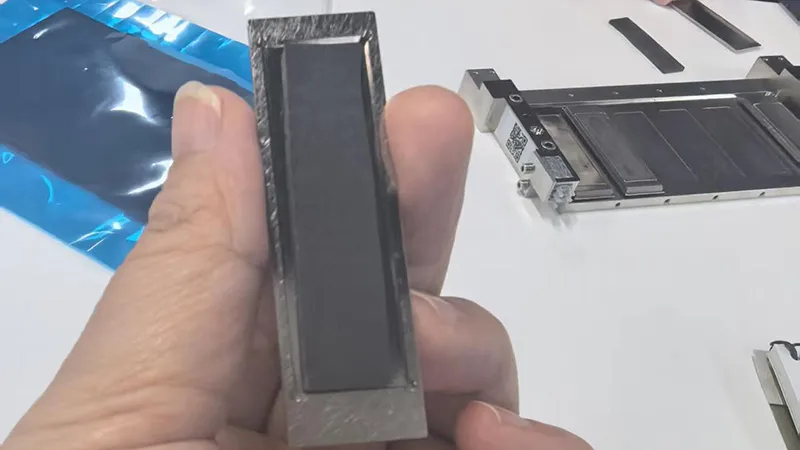
Figure 2. CSF20-HR carbon fiber thermal pad applications for optical module liquid cooling.jpg.
Different materials, different posts. In one stack, the PCM owns the fine gaps and the carbon fiber elastic pad owns the preload on the floating copper block.
Further reading referenced in the source material: Parker thermal material selection guide · Parker phase-change application notes · Panasonic PGS in-plane conductivity data.
It Fits on Day One. Why Does It Warm Up Later?
Imagine acceptance day: all six slots pass. Then the equipment runs, a module gets swapped during maintenance, and one slot's shell temperature starts to creep. After you clear the flow path, you can trace the fault back through this same pad. Watch the chain with us:
- Long-term compression leaves the pad unable to recover thickness — or its holding force weakens.
- The copper block then mates more loosely.
- Effective contact area shrinks; local air gaps can appear.
- Contact resistance climbs — and in severe cases the system throttles.
Clamping force can decay even while the pad stays compressed. Unloaded recovery tells you how much comes back after you pull the module; a constant-compression retention test tells you how much preload remains while the module is installed. Read both. Never settle for one.
2 mm Pad, Squeezed to 1.4 mm: The Numbers
A 2.0 mm pad in a 1.4 mm gap loses 0.6 mm — that is 30% compression. Squeeze a little harder: does heat transfer get better, or does insertion just get harder? Here is what our first-round re-test on 2.0 mm CSF20-HR samples found:
| Compression | Peak Stress Avg. | Stress Avg. After 10 min | Thermal Resistance (°C·in²/W) |
|---|---|---|---|
| 10% | 3.60 psi | 2.91 psi | 0.321 |
| 20% | 12.38 psi | 5.08 psi | 0.189 |
| 30% | 33.11 psi | 13.41 psi | 0.180 |
| 40% | 49.66 psi | 16.80 psi | 0.196 |
| 50% | 77.26 psi | 21.27 psi | 0.214 |
Table 1. Stress data from the 2026-09-02 report, 25 × 25 mm specimens, five pieces per step. Resistance from the 2026-08-25 ASTM D5470 report. The two data sets were measured separately.
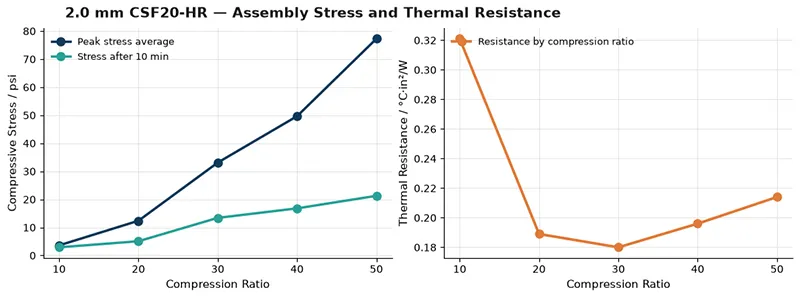
Figure 3. Bench curves at the same nominal thickness. Lines between points guide the choice of re-test conditions.
From 30% to 40%, average peak stress climbs from 33.11 to 49.66 psi, while the resistance reading moves from 0.180 to 0.196 °C·in²/W. For this batch of 2.0 mm samples, the 30% neighborhood deserves first bench validation. Scaled by specimen area, that step gives a peak normal load of roughly 143 N, and about 58 N after 10 minutes. Real insertion force also depends on the sliding face and the structure, so measure it separately on the module. The resistance report also has a fixed-pressure run: 0.277 °C·in²/W at 30 psi. When you request samples, ask for post-compression thickness, face pressure, and resistance together.
And one mental unit worth pinning down: % says how far the pad was compressed. psi says how concentrated the force on the pad is. Do not let the two trade places in a meeting.
After You Pull the Module: How Fast Does the Pad Recover?
We used 1.7 mm samples to observe one maintenance interval. After 30% compression held for 30 minutes and then released, average recovery at 5 minutes, 30 minutes, and 2 hours was 89.15%, 93.27%, and 94.76%. If a module gets swapped right away, the short-term number is the one that matches the field:
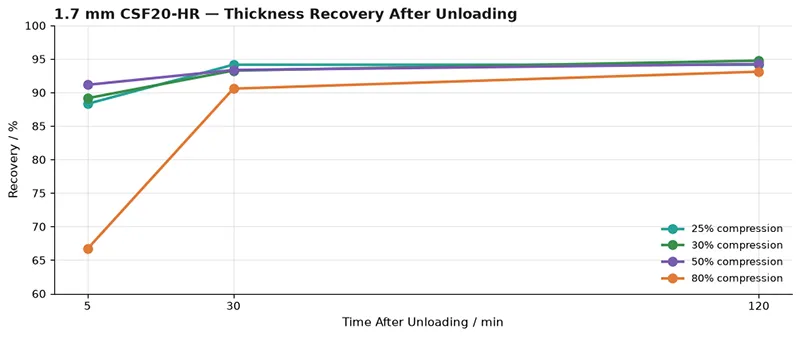
Figure 4. Unloading recovery of 25 × 25 × 1.7 mm specimens. Five pieces per step; the original report lists ASTM D575.
| Compression | 5 min Avg. Recovery | 30 min Avg. Recovery | 2 h Avg. Recovery |
|---|---|---|---|
| 25% | 88.31% | 94.15% | 94.15% |
| 30% | 89.15% | 93.27% | 94.76% |
| 40% | 92.38% | 94.92% | 95.76% |
| 50% | 91.15% | 93.36% | 94.25% |
| 60% | 91.48% | 94.20% | 94.92% |
| 70% | 89.51% | 94.67% | 95.64% |
| 80% | 66.67% | 90.58% | 93.11% |
Table 2. Recovery = recovered displacement ÷ original compressed displacement. 80% compression is an extreme test step; at 5 minutes its average recovery is only 66.67%.
Test the Tightest and Loosest Slots Before You Go Live
Let us run a simple comparison. Assume the gap is 1.4 ± 0.3 mm. A 1.7 mm pad barely gets compressed in the loosest slot. A 2.0 mm pad gets crushed to 45% in the tightest. Look only at the nominal gap and both risks hide from you:
| Nominal Thickness | Tightest 1.1 mm | Nominal 1.4 mm | Loosest 1.7 mm | First-Round Check |
|---|---|---|---|---|
| 1.7 mm | 35.3% | 17.6% | 0% | Verify contact at the max-gap end. Nominal point sits below existing recovery test range — test first |
| 2.0 mm | 45% | 30% | 15% | Nominal point near existing bench points; measure peak load and insertion force at the tightest slot |
Table 3. Converted from nominal thickness. Compression = (free thickness − assembly gap) ÷ free thickness. Real installation still stacks pad tolerance and copper-block travel on top.
In the case, 20 W per port over a nominal 6 cm² heat area gives about 3.3 W/cm² heat flux. Recalculated under the case assumptions, the module-shell-to-groove-base temperature-rise budget lands near 4.2–4.6 °C. On the bench, record shell temperature, cold-plate near-interface temperature, and inlet coolant temperature together — that is the only way to locate which segment is eating your delta-T.
After Aging, Re-check Hardness Too
We aged 2.0 mm CSF20-HR specimens in ovens at 125 °C and 150 °C for 2,000 hours each. At the end, resistance, short-term recovery, and hardness all met the report's acceptance criteria, with no visible cracking or chalking. One number worth your attention: the 150 °C group's hardness rose from Shore 00 47 to 59. That is why we still ask for a re-measure of clamping force, insertion force, and module shell temperature on the real hardware:
| Metric | Report Original | 125 °C · 2000 h | 150 °C · 2000 h | Acceptance Line |
|---|---|---|---|---|
| Resistance @30 psi (°C·in²/W) | 0.304 | 0.241 | 0.219 | ≤0.33 |
| Short-term recovery | 92.2% | 98.01% | 98.01% | ≥80% |
| Hardness Shore 00 | 47 | 55 | 59 | ±15 vs original |
Table 4. Material aging report. Resistance re-tested at 30 psi. Recovery test used 50% compression with hold and recovery of 30 minutes each. Whole-system lifetime must be validated against your actual compression, temperature, and swap frequency.
The Same Question Shows Up Elsewhere
Once you have solved it for the optical module, you will recognize the same problem in other hardware:
- NIC or DPU OSFP cages, where the press-fit heatsink rides on the module the same way.
- Optical-module test sockets and burn-in fixtures that open and close every day — they care most about recovery after repeated compression.
- Liquid-cooled server DIMMs, SSDs, and OAMs, if floating blocks compensate tolerance — the same test method transfers directly.
- GPU cold-plate secondary interfaces — watch large-area, low-pressure mating and pump-out risk.
- CPO optical engines — track local power and gap at the same time.
- Power modules against a cold plate, where magnetics, capacitors, and MOSFETs create multiple contact points — check that load is distributed evenly.
In every one of these, the material is decided by the real assembly gap, load, and maintenance conditions — not by a category name.
Six Data Sets to Ask Your Supplier For
20 W/m·K is a material parameter. What an engineer actually needs is the resistance and clamping force that survive after the pad is compressed to the drawing's gap, installed in the real cold plate, and aged. Only with curves and test conditions in hand can sample data reach your own workstation:
| What to Ask For | What It Answers | Case Reference |
|---|---|---|
| Compression stress–strain | Will the tightest spot press too hard, and the loosest fail to hold? Ask for peak and post-hold stress. | 20–50 psi at 25% compression as a discussion start; real window depends on allowed load and contact area |
| Resistance vs compression | At the real assembly gap, how much does the interface slow heat? Ask for post-compression thickness, face pressure, resistance unit. | ASTM D5470 at 20/25/30% steps; working-point threshold set by your thermal budget |
| Compression set | After constant compression plus heat, how much thickness returns on unload? | ≤5% after 100 °C × 22 h as a reference target |
| Post-cycle recovery retention | After repeated insertion/compression, how much recovery remains? | ≥90% after 1,000 compression cycles as a reference target; align the denominator and read time after unload |
| Volatiles & condensation deposition | Near optical faces, will released substances deposit nearby? | Screen with ASTM E595, TML <1.0%, CVCM <0.1%; validate the real optical face if needed |
| Coolant compatibility | After exposure to the real coolant, how much does resistance drift? | For exposure-required projects, discuss <10% resistance drift after ethylene-glycol system at 85 °C × 1,000 h |
Table 5. These are validation references from the case material. At project start, fix the method, specimens, and acceptance line — and request the corresponding measured reports. ASTM E595 screens vacuum outgassing.
And on resistance: read the unit before the number. The case material discusses a target of ≤0.20 °C·cm²/W. The original bench report at 30% compression reads 0.180 °C·in²/W — which converts to roughly 1.16 °C·cm²/W. If both describe the same interface area and duty, that measured point sits above the target. Align interface area, effective area, and test conditions before acceptance.
To validate long-term service, install the pad in the real structure and re-test under the project's constant-compression and temperature conditions. We suggest 1,000 hours as a discussion checkpoint, watching resistance, face pressure, and slot temperature difference together.
Method references from the source: ASTM D5470 resistance testing · NASA outgassing and optical-deposition requirement examples.
From a Sample to a Design Spec
Send us the cold-plate boss length and width, the minimum / nominal / maximum gap, per-port power, and the allowed load — a de-identified cross-section helps too. When a floating copper block needs both preload and tolerance compensation, start with CSF20-HR in two thicknesses. For thin gaps or structures that already have their own clamping, add CSF30-HC and CSF45 as same-condition controls:
| Model | TDS Through-Thickness Conductivity | Priority Validation Use |
|---|---|---|
| CSF20-HR | 20 W/m·K | Floating copper block needing both preload and gap compensation; test tightest and loosest slots first |
| CSF30-HC | 30 W/m·K | Resistance comparison in thin gaps; check working compression ratio and corresponding load |
| CSF45 | 45 ± 4.5 W/m·K | When the thermal budget is tighter, compare shell temperature at the same thickness, compression, and load |
Table 6. Through-thickness conductivity quoted from each model's Chinese TDS, ASTM D5470 basis. Under the 1.0 mm / 10–15% compression TDS condition, CSF30-HC and CSF45 reference resistances are 0.10 ± 0.02 and 0.07 ± 0.02 °C·in²/W respectively. Confirm delivery specs against the sample documentation.
Once samples arrive, follow three steps:
- Make two sample sets. Die-cut to the boss footprint, with a selection sheet stating each set's compression ratio and estimated face pressure. Regular sampling can be discussed with Sheen on a one-week arrangement; actual lead time follows drawing review and production scheduling.
- Install the pad in the real cold plate. Measure load and insertion force at both tolerance ends first, then compare against your current material at the same inlet temperature, flow, and module power. Record assembled resistance, face-pressure distribution, and the highest shell temperature plus slot-to-slot spread across six positions.
- Write the validated conditions down. Put the usable compression range, anomaly criteria, and replacement criteria into the drawing and assembly SOP, and organize the material approval and reliability data package per your project flow. Your next-generation model then inherits a reusable set of thermal-interface parameters.
For die-cut samples and data, contact Sheen to confirm dimensions, stock, lead time, and batch-inspection requirements.
Request CSF samples: https://www.sheenthermal.com/feedback.html
Sources: Sheen “Optical Module Liquid-Cooling Thermal Pad Application Case,” CSF20-HR compression-stress / thermal-resistance / recovery reports, the 2,000-hour reliability report, and the CSF series Chinese TDS documents. All values are quoted as published with their stated test conditions; reference targets are discussion points for your project, not universal guarantees.
Sheen Thermal
Dongguan Sheen Electronic Technology Co., Ltd · Founded in 2008
Manufacturer of thermal interface materials and silicone foam for automotive electronics, energy storage, power electronics, communications and consumer electronics.
Certified
- ISO 9001:2015
- ISO 14001:2015
- IATF 16949:2016
What we supply
- Thermal conductivity Up to 130 W/m·K
- Thickness 0.3–10.0 mm
- Custom & samples Die-cut to drawing, 3–7 days
LAST:Nothing